Full Report
Fit
Outside the framework's universe (U2 not met); contested: P2
The framework's universe test asks for a market capitalization above $10 billion. Sportradar's is $4.34 billion, and no construction of the share base or the price record in this run reaches the line. That result is reached at high confidence: two model families agreed, the trial was order-stable, and load-bearing spreads were at most 0.15. No exclusion was hit, no sensitivity flag was raised, the name-mask probe found no prior-driven risk, and one criterion — P2, free cash flow consistency — came back contested.
Market capitalization (USD bn)
Universe line (USD bn)
Shortfall (USD bn)
Sources: FY2025 Form 20-F cover page and Note 19 [1] [2], Note 19.3 treasury shares [3] and the 2026-07-27 close [4].
Universe and exclusions
U2 — scale. Not met, on a 4-0 vote across both model families, and the masked seat agreed. At December 31, 2025 the company had 221,390,294 Class A and 903,670,701 Class B ordinary shares in issue, inclusive of treasury [5]. Class B converts ten-for-one, so the gross Class A-equivalent base is 221,390,294 + 90,367,070 = 311,757,364 [6]. Treasury holds 3,939,842 Class A plus the 120,000,000 Class B parked pending cancellation, or 12,000,000 Class A-equivalents, leaving 295,817,522 net [7]. At the July 27, 2026 close of $14.68 that is $4.343 billion [8] — 43.4% of the line, $5.66 billion short of it.
The generous constructions do not close the gap either. Gross of every treasury share the figure is $4.58 billion. At the highest close in the run's price file, $19.69 on 2026-03-19, it is $6.14 billion. At the September 2021 IPO price of $27.00 per Class A share — the highest arm's-length mark verified anywhere in this corpus — it is $8.42 billion, still 16% below the line [9].
Sources: share counts from the FY2025 20-F cover page, Note 19 and Note 19.3 [10] [11] [12]; prices from the run's daily series [13]; IPO price from the 2021 prospectus [14].
The deterministic feature file could not supply this number at all — market capitalization is recorded as not computable for want of a positive period-end share count — so every figure above is built from the primary filings and the dated close, and the disagreement is recorded rather than papered over.
U1 — listing. Met, 4-0. Sportradar Group AG is a Swiss-incorporated registrant whose Class A ordinary shares, nominal CHF 0.10, are registered under Exchange Act Section 12(b) and listed on The Nasdaq Global Select Market under SRAD [15]. The security traded is the ordinary share, not a depositary receipt, so the test is satisfied on either limb. The governance fact that sits alongside it: the 903,670,701 Class B shares carry 80.3% of the votes on 29.0% of the Class A-equivalent economics [16].
The exclusion screen came back clean. All four disqualifying tests were checked against primary evidence and none was hit; the single sensitivity flag was also negative.
- X1, auto manufacture — not met. All €1,289,965k of FY2025 revenue is Betting Technology and Solutions (€1,047,070k) and Sports Content, Technology and Services (€242,895k) [17]. The named competitor set is Genius Sports, Stats Perform, Infront Sports and Media, and BetConstruct [18]. A targeted search of the revenue, segment, competition and non-current-asset disclosures found nothing on the other side.
- X2, promotion pattern — not met. The test requires cited instances on both prongs. The ownership prong is not merely unproven but contradicted: the founder-CEO held 1,840,883 Class A and 783,607,701 Class B at March 12, 2026, which is 80,201,653 Class A-equivalents of a 299,757,364 base, or 26.8% of the economics on 78.7% of the votes [19]. The counter-fact inside the same finding: he is a net seller, down from 30.2% twelve months earlier [20], over a period in which officers and directors had no Section 16(a) reporting obligation. On the delivery prong the record shows one clean guidance break — an August 2023 reaffirmation followed on November 1, 2023 by a revision to €870-880m [21] — and one long-term target reset, from the IPO-era at-least-20% growth and 25-30% margin to at-least-15% CAGR and a 27% margin at the April 2025 Investor Day [22]. One break and one reset is not the repeated pattern the exclusion names.
- X3, structural decline — not met. Revenue rose in all seven fiscal years on record, from €380.4m in FY2019 to €1,290.0m in FY2025, and the feature's consecutive-decline counter is zero. The strongest surviving fact against that reading sits on the input side, not the customer side, and is treated in the year-10 gate below.
- X4, consensus-saturated story — not met. The consensus prong is plainly satisfied: 16 strong buy, 2 buy, 4 hold and no sell across 22 analysts, mean target $21.15 against the $14.68 close, 44.1% implied [23]. The valuation prong is not. Equity value is 2.81x to 3.37x FY2025 revenue across a 1.00 to 1.20 dollar-per-euro range, and about 4.2x on an enterprise basis that adds the entire €1,529.2m licence fee payable [24]. The test needs both prongs; it has one.
- S1, China dependence — not flagged. No document in the corpus states a China revenue, asset, customer or supplier figure. Note 5 names Switzerland as domicile plus every country above 10% of revenue — Malta and the United States — and states that no individual country exceeded 10% of the total, which caps China revenue below €129.0m and caps China non-current assets inside the €109.5m "other countries" line [25]. The bound is inferred from a regional aggregate and a negative disclosure threshold, not read from a stated number.
Pattern match
The reader contract carries four recognition setups: cyclicals at the bottom, and large banks in particular; a high dividend yield paired with a high free cash flow yield on a business that is not going away; healthcare or insurance forecasting errors that reprice out; and quality tech monopolies or duopolies on a fear dip. Sportradar fits none of the four squarely.
The nearest lens is the fourth, and it is worth running because the surface features match: a data and rights layer with few credible suppliers, priced 25.44% below its March 2026 high after a specific, testable fear — two short-seller reports alleging revenue from unlicensed operators [26]. Three of that pattern's own checks fail. The market structure is an oligopoly with four named rivals rather than a monopoly or duopoly [27]. The scale is a fifth of the pattern's precedents and below the framework's own universe line. And the pattern assumes a business whose cash generation is visible through the dip; here the adjusted yield is 1.55% to 1.66% against an 8.5% bar. The second setup is unavailable outright — no dividend has ever been declared [28] — and the first and third describe balance-sheet and regulated-repricing businesses this is not.
The pillar ledger
Every criterion below is the tally's aggregate. Reference lines are stated as arithmetic; the thresholds are the framework's, not a score.
Source: the run's deterministic fit tally, aggregating four jury seats plus a name-masked seat over the pillar claims ledgers.
Year-10 gate
P1 — not met, 4-0 across both families, masked seat agreeing. Trimmed-mean probability 0.685, spread 0.15. The gate asks whether year-10 revenue and year-10 adjusted free cash flow will both be higher than today's, with very high conviction, and it resolves genuine doubt to not met by construction.
What supports the durable reading is contracted and disclosed. Unsatisfied performance obligations stood at €2,122.6m, of which €1,357.0m is scheduled for 2026 recognition [29]. Two thirds of revenue sits on fixed-fee recurring contracts of one to five years [30], no customer exceeds 10% of revenue and the top ten are 27% [31], and the end market the company cites is projected to compound 9% a year from $127.1bn in 2025 to $192.7bn in 2030 [32]. The disqualifier is not triggered: seven consecutive years of revenue growth, zero consecutive decline years.
The strongest surviving counter-facts sit in the same treatment, and they are what moved the jury. That backlog is front-loaded — 63.9% of it lands inside 2026 and 5.7% beyond 2028 [33]. The only disclosed expansion metric fell to 109% in 2025 from 127% in 2024, on a top-200 cohort that shrank from 83% to roughly 79% of revenue, and the filing gives no decomposition of that fall between pricing, contraction and attrition [34]. And the input side re-priced: sport rights expense ran 24.41%, 31.85% and 31.34% of revenue across FY2023 to FY2025, a 6.93-point re-basing in one renewal round of which only 0.51 points has come back [35]. That reinvestment is financed on vendor credit: €1,529.2m of licence fee payables for capitalized sport rights [36], against total loans and borrowings of €62.9m — a ratio of 24.3x [37]. Against that, the cost is already inside the reported numbers, €270.2m of it amortization rather than a cash call [38], and free cash flow still rose from €58.4m in FY2023 to €174.7m in FY2025 [39]. The company also names its own year-10 hazards: disintermediation by leagues, and prediction markets that "may reduce the size, scale, or growth of traditional sports betting markets" [40]. Full treatment in The Barrier and the Bill.
The framework's other conviction source is unavailable by construction: the business was founded in 2001 and has been public since September 2021, so there is no 30-to-50-year record against which to test through-cycle durability.
Consistency
P2 — contested. Two seats read not met, two read cannot determine; the masked seat read not met. This is the only criterion where the two model families diverged, and it is treated in full under Contested and undetermined below.
Dislocation and yield
P3a — identifiable event. Met, 4-0. The trigger is dated, named and carries a mechanism: short-seller reports published on April 22, 2026 alleging revenue from illegal gambling operators, on which the shares fell 22.57% in a single session, from $16.84 to $13.04, on 27,482,052 shares [41] [42]. Counter-fact in the same treatment: 38.8% of the $7.34 peak-to-trough decline preceded the event, with the stock falling 14.47% from $19.69 on March 19 to $16.84 on April 21 and no dated cause anywhere in the corpus for that leg. The event is also an outside allegation rather than a company disclosure of worse numbers.
P3b — capitulation. Met, three seats to one cannot determine. The reference line is a fall-leg volume multiple of at least 2x the trailing median. The deterministic feature prints 1.6253x, below the line — and its denominator is one trading session, because the run's price file begins on 2026-03-18, a single session before the peak, rather than the 180 sessions the definition requires. Measured on the tape that does exist, the event session traded 12.31x the 23-session pre-event median and 11.30x the 90-session median, and the five sessions from the event to the trough averaged 5.79x [43]. Both readings are on the page; the feature's figure was reported, not replaced.
P3c — yield against the bar. Not met, 4-0. On the framework's own basis — free cash flow less stock-based compensation less the trailing five-year average of cash spent on acquisitions — FY2025 adjusted free cash flow is €174.7m − €54.9m − €57.3m = €62.5m [44]. Against a market capitalization of roughly $4,343m that is an adjusted yield of 1.55% to 1.66% across the run's plausible currency range, 684 to 695 basis points below the 8.5% fortress bar and roughly 2,340 basis points below the 25% levered bar. The three-year average is worse: €17.0m of adjusted free cash flow across FY2023 to FY2025, a 0.42% to 0.45% yield, some 806 basis points from the bar, because FY2023 was negative €38.5m.
Which bar applies is itself two-sided, and the answer does not change the result. On the reported loans-and-borrowings line the company is net cash by €302.4m — borrowings of €62,852k are entirely lease liabilities against €365,295k of cash, with a €220.0m revolver undrawn [45] — which selects the 8.5% fortress bar [46] [47]. Including the €1,530.9m of interest-bearing sport-rights payables, which cost €85.6m of cash interest in FY2025, net debt is €1,228.5m and 4.14x FY2025 adjusted EBITDA of €296.8m, which selects the 25% levered bar [48] [49]. The measured yield clears neither. The fortress signature the framework looks for — a stable 3.5% to 4% historical yield that suddenly jumped toward the bar — does not exist here, because adjusted free cash flow was negative in FY2023 and €26.8m in FY2024. Full treatment in Rights Bought on Credit.
P3d — forward path. Not met, 4-0. Trimmed-mean probability 0.285, spread 0.12. Consensus free cash flow of €227.0m, €296.8m, €375.5m and €492.5m for FY2026 to FY2029, less growing share-based compensation and the trailing acquisition average, gives adjusted yields of 3.6-4.1%, 5.4-6.2%, 7.2-8.4% and 9.9-11.6% on today's capitalization. The 8.5% bar is first cleared in FY2029 — one year outside the three-year window.
Source: derived from reported financials — consensus free cash flow from the run's estimates record [50], adjusted using share-based compensation and cash acquisitions from the FY2025 consolidated statements of cash flows [51]; the band spans the tested currency and share-compensation treatments.
The counter-fact belongs in the same breath. On the most generous permissible treatment — share-based compensation frozen at FY2025's €54.9m and a weak dollar — FY2028 computes to 8.39%, 11 basis points short, which is inside the estimation error of the compensation assumption itself. And the repurchase authorization is a genuine mechanism: $1.0 billion, equal to 23.0% of the market capitalization, which if fully executed at prices near $14.68 would lift the FY2028 figure above 9% [52]. Against that, total liquidity was €542m at March 31, 2026, so most of that programme would have to be funded out of the same forward cash flow being counted in the numerator. The skeptic pass weakened the pillar's own point estimate of 0.25 to a qualitative near-miss, on the ground that the corpus does not support a deterministic figure; the tally's 0.285 is the jury's aggregate, not the ledger's.
Balance sheet and self-help
P4a — outlast and allocation headroom. Met, 4-0. There is no debt maturity schedule to build. The entire loans-and-borrowings balance is lease liabilities [53], the €220.0m revolving facility is undrawn, and the company was in covenant compliance at December 31, 2025 and expects to remain so [54]. No refinancing event can force a paydown that displaces repurchases. The obligation with any power to crowd them out is the rights bill, not debt: €319.4m of licence payables fall due within twelve months, up 79% from €178.3m, and €1,209.9m beyond [55]. In the most recent quarter liquidity fell from €585m to €542m while €91m of repurchases ran, so the buyback is currently drawing on the balance sheet rather than being covered by the €44m of quarterly free cash flow [56] [57].
P4b — repurchase engine. Not met, 4-0. Repurchases are executed cash, not authorization language: €9.0m, €28.7m and €105.2m across FY2023 to FY2025 on the financing line of the audited cash-flow statement, plus €91m in Q1 2026 alone [58]. What three years of that bought is the point the criterion turns on, and the answer depends on which share-count basis governs. Point-in-time, Class A-equivalents net of treasury fell from 297,930,657 to 295,817,522, a decline of 0.71%. On the weighted-average diluted series the company itself reports for earnings per share, the same base rose from 317,013k to 319,365k, up 0.74% [59] [60]. Either way the two-year movement is under 1% in absolute value: no demonstrated multi-year reduction, and no unambiguous rise either, so the hard-fail rule on a rising share count did not fire. The deterministic feature that would settle it is null. The offsetting fact is that the issuance is compensation and licensor equity rather than acquisition currency — €59.9m of share-based compensation expensed in FY2025 [61] against €105.2m of gross treasury spend [62], and that of the 5,127,074 shares bought in FY2025, 4,130,572 ran under the announced programme at an average $22.10 [63]. Full treatment in Guidance and Control.
P4c — dividend cover. Not applicable, 4-0. The criterion activates when a dividend yield of roughly 4% or more is material to the return case. Sportradar has never declared or paid a dividend since incorporation in 2021 and does not anticipate one [64]. The yield is 0%, so there is no cover ratio, no downturn record and no commitment language to test. This is an absence of content, not an absence of data.
Diagnosis
P5 — temporary versus permanent. Met, 4-0. Probability that the impairment is temporary: 0.66, spread 0.05, carried from the adversarial trial. The trial ran three independent judges over two opposing cited briefs; reading order barely moved the answer, with a temporary-first mean of 0.66 against a permanent-first mean of 0.685, a gap of 0.025.
The supporting fact is a guidance delta of exactly zero. The FY2026 outlook table published March 3, 2026 and the table published April 28, 2026 — six days after the short reports — are line for line identical: €1,557-1,582m revenue at 23-25% constant currency, €390-400m Adjusted EBITDA, 25.0-25.3% margin, free cash flow conversion above 56% [65] [66]. Three months later FY2026 consensus revenue of €1,556.2m still sits 0.05% under the guided floor. Nothing in the reported operating record broke: the last printed quarter grew revenue 11% to €347m, Adjusted EBITDA 12% to €66m and free cash flow to €44m [67].
Here is the qualification that belongs with it. That intact consensus is the weakest available witness to its own resilience — the 21-analyst FY2026 revenue high is also at the guidance floor, and exactly one of 22 published price targets sits below the market [68]. No published estimate line in the corpus has been rebuilt on a reduced revenue base, which is absence of analysis rather than evidence of an intact valuation. The quarter above closed on March 31, three weeks before the reports, so the corpus holds no post-allegation operating observation at all; the first is the Q2 print scheduled for August 3, 2026. And the size of the contested base is unmeasured from outside: the reports estimated 20-40% of revenue, the chief executive put it at "5% to 12%, 13%" on the April 28 call from a client-by-client build the company has not disclosed [69] [70]. Full treatment in Priced for an Allegation.
Instrument context
I1 — not verifiable, 4-0. This criterion never blocks a pillar verdict; it drives the watchlist overlay, which does not apply here because the overlay attaches only to a fitting or leaning-toward-fitting result. Listed options carrying a January 21, 2028 expiry existed as of the July 27, 2026 quote — 543 days, or 17.8 months, clearing the 12-month floor and just short of the 18-month target — and implied volatility was retrievable from a dated source at a 72.53% 30-day mean and a 62.47% 180-day mean, the 30-day reading sitting above the framework's 60-70 elevated band with results six days out. The open-interest and spread prong could not be verified at either qualifying expiry: only the front-month August 21, 2026 chain was served by any reachable source. The skeptic pass marked the whole claim unverifiable because its support is external and dated rather than a corpus page, and this tab does not link it as a filing citation.
What a 3x-in-3-years would require
The framework's target test values normalized adjusted free cash flow at the applicable bar yield and asks what consensus would have to concede to get there. The tally records the arithmetic as unavailable: "Re-rating math unavailable because the applicable bar or normalized adjusted FCF is missing." Both inputs are genuinely missing rather than unfavourable.
The bar is undetermined because the balance-sheet class is. The deterministic feature returns "unknown", and the two defensible readings of the same balance sheet — net cash of €302.4m on the reported borrowings line, or net debt of €1,228.5m at 4.14x adjusted EBITDA once the sport-rights payables are counted — select 8.5% and 25% respectively, a three-fold spread in the applicable line. Normalized adjusted free cash flow is not computable on the framework's own definition: the feature file carries no share-based compensation for any year FY2019 to FY2025 and no complete consecutive five-year acquisition window, and reconstruction from the primary cash-flow statements closes only three years, FY2023 to FY2025, at −€38.5m, €26.8m and €62.5m. A three-year mean of €17.0m is not a normalized figure; it is a trailing average across an investment step-up.
Base-rate context from prior drawdown episodes is also unavailable in this run. The price file holds 90 sessions beginning 2026-03-18 and is flagged as partial history, so no cycle high, no prior peak-to-trough episode and no recovery base rate can be measured — the drawdown labelled against a three-year high is in fact computed over that 90-session window. What can be stated is the observed path: 37.28% peak to trough, and 25.44% below the peak at the July 27 close after an 18.87% recovery off the low [71].
Contested and undetermined
One criterion was contested. Nothing was returned as cannot-determine at the tally level.
P2 — free cash flow consistency. Contested: two seats not met, two seats cannot determine, across the two model families; the name-masked seat read not met.
The criterion asks whether the rolling five-year average of adjusted free cash flow is stable, with any negative episode explained by a business-model-inherent cycle recurring every five to eight years. Both readings rest on the same fact: that rolling average cannot be computed.
The not-met reading. The metric is unavailable, but the question settles anyway on the years that do compute. Adjusted free cash flow runs −€38.5m, €26.8m and €62.5m across FY2023 to FY2025 — one negative year in three, a mean of €17.0m, a peak-to-trough range of 5.96x that mean [72]. On unadjusted free cash flow the seven-year record has a coefficient of variation of 86%, including €1.5m in FY2021 and €5.5m in FY2022 — years in which revenue grew 38.6% and 30.1%, so those troughs cannot be the inherent cycle the criterion's escape hatch names. They are capital-intensity timing.
The cannot-determine reading. The designated metric is missing and the substitutes do not replace it. Revenue growth and an investment-timing explanation answer a different question from the one the criterion asks, and three years is not five.
The named missing datapoints, recorded by the seats that returned cannot determine: "five consecutive adjusted-FCF years needed to compute rolling 5-year adjusted FCF stability", and "five consecutive adjusted-FCF years; FY2015-FY2018 cash-acquisition inputs needed for the rolling 5-year adjusted-FCF stability metric". The gap is structural, not clerical: the framework's trailing five-fiscal-year acquisition term for FY2021 needs cash-acquisition figures back to FY2017, and the earliest audited consolidated cash-flow column that exists for this company anywhere is FY2019, in the IPO registration statement.
The fact that cuts the other way, in the same treatment: cash paid for intangible assets has fallen as a share of revenue in every year, 24.1% in FY2019 to 17.3% in FY2025, and absolute cash intangible capex was flat year over year in FY2025 on revenue up 16.6% — which is what a step-up that is genuinely finishing looks like [73].
Because the universe test decides the overall result, P2's contested status does not change it. It is recorded here as contested rather than resolved.
Provenance
Source: the run's deterministic fit tally and its skeptic ledger.
How hard the verdict was pressed, in short. Every criterion was voted independently by four seats drawn from two different model families, plus a fifth seat that saw the same evidence with the company's name removed — and the masked seat reached the same verdict on every gate, which is what makes the prior-driven-risk flag negative. Each verdict-critical claim was then re-derived from its cited pages by a separate skeptic: of 61 claims, 17 were pressed beyond triage, and the two that did not survive intact were a probability point estimate downgraded to a qualitative near-miss and a claim that no adversarial trial existed, refuted by the trial artifacts themselves.
The falsifier ledger
These are the standing conditions that would change the reading. The first five are the framework's own templates; the rest are the name-specific versions nominated by the trial judges and the jury seats, several of which converged on the same August 3 print and the same licensing mechanism from different directions.
- adjusted FCF or EBITDA declines where flat-or-better was underwritten
- revenue declines for a third consecutive year
- capital allocation pivots to debt paydown over repurchases
- share count inflects upward
- the industry repricing cycle fails to materialize where industry-wide mean reversion was underwritten
- Q2 results on 3 August 2026 cut or qualify the FY2026 EUR1,557-1,582m revenue / EUR390-400m Adjusted EBITDA guide, or net retention falls below 100% - the guide requires 23-25% cc growth against Q1's actual 11% reported / 16% cc, so the reaffirmation is the load-bearing claim and it is testable within days.
- Q2 results on 3 August 2026 cut the FY2026 EUR1,557-1,582m revenue or EUR390-400m Adjusted EBITDA guidance, or net retention falls below 100%.
- Q2 2026 or FY2026 reporting cuts the €1,557-€1,582m revenue or €390-€400m Adjusted EBITDA guide, or net retention falls below 100%.
- Any formal enforcement, licensing or suitability action opened against Sportradar itself by a US state regulator, the UKGC, the MGA or the DOJ - the mechanism by which permanent pruning actually occurs, and the only thing that converts the FY2025 Annual Report's own 'may ultimately result in a loss of revenue' language into realised loss.
- A formal enforcement, licensing or suitability action is opened against Sportradar itself (UK, Malta, a US state regulator, or DOJ) by year-end 2026.
- A regulator or licensing authority opens a formal action requiring Sportradar to cease, restrict, or remediate disputed customer relationships.
- The FY2026 20-F or class-action discovery disclosing gray-market exposure materially above the 12-13% ceiling management gave on the Q1 call - i.e. any independent evidence moving toward Muddy Waters' 20-40%, since today's residual $674m of lost value roughly capitalises the 13% band in full and the incremental downside lives only above it.
- Audited disclosure or discovery shows illegal/gray exposure materially above management's low-to-mid-single-digit estimate or above the 12% adverse-simulation bound.
- The FY2026 20-F contradicts the 12%-or-below bound - restatement, auditor emphasis-of-matter, or disclosed exposure materially above management's figure - or the CEO's pledged $10m personal purchase goes unexecuted.
- A Tier-1 operator or a major rights holder (MLB/NBA/UEFA/ATP) terminating or declining renewal on revenue-quality grounds, or the CEO's pledged $10m personal purchase going unexecuted after the trading window opened.
- Disclosed customer pruning or a counterparty defection: a Tier-1 operator or any of MLB/NBA/UEFA/ATP terminating or declining renewal, or exited gray-market clients exceeding ~5% of revenue.
- A Tier-1 operator or major rights partner terminates, declines renewal, or reprices on terms that leave rights expense/payables structurally mismatched to revenue.
Data gaps
What this run could not answer, as recorded by the tally.
The feature file could not compute the verdict-bearing numbers. Market capitalization is null for want of a positive period-end share count, and adjusted FCF, adjusted FCF yield, the yield baseline, float retirement years, balance-sheet class, FCF stability and the share-count trend are null in consequence. Every market-capitalization, yield and share-count figure on this tab is reconstructed from primary filings instead. Three disagreements are recorded rather than silently substituted: share-based compensation is on the face of every cash-flow statement despite the feature reporting it missing; borrowings and cash are both on the FY2025 balance sheet despite the balance-sheet class reporting them missing; and the canonical facts file reports zero cash acquisitions for all seven years against audited figures of €198.4m (FY2021), €56.2m (FY2022), €12.8m (FY2023), €27.1m (FY2024) and a €7.9m inflow (FY2025) — an error worth about 142 basis points of yield.
Adjusted free cash flow closes only three years. Five consecutive adjusted-FCF years are needed for the stability metric; FY2015-FY2018 cash-acquisition inputs do not exist anywhere, the earliest audited cash-flow column being FY2019. Two defensible definitions of share-based compensation also exist and the framework does not disambiguate them — the cash-flow add-back of €54,877k or the €59,918k expensed in the income statement — giving FY2025 adjusted FCF of €62.5m or €57.5m. Sign and ranking are unaffected in all three years.
The price history is 90 sessions. It begins 2026-03-18 and is flagged partial. There is no 52-week or multi-year high, no fiscal-year-end close before 2026, and therefore no measured per-year yield history and no company trading-multiple history. The 180-day pre-peak median volume the specified volume-spike multiple requires does not exist; the printed 1.63x divides by a single session. The technical-analysis files return "unavailable" and an illiquidity flag for the same reason, and neither should be read as evidence about the shares' tradability — they are listed on Nasdaq and traded 1.90m shares a session on average over the 20 sessions to July 27.
No exchange rate is staged anywhere in this run. Every comparison between a dollar market capitalization and a euro reporting base carries an unstated assumption; yields are reported across a 1.0769 to 1.15 band, and the price-to-sales multiple across 1.00 to 1.20. The conclusion is invariant across the range for the current yield and for the sales multiple; it is material to the forward path alone, where the same range moves the FY2028 figure from 6.9% to 8.8% and straddles the bar.
The retention fall cannot be decomposed. The metric is defined net of contraction and attrition and excluding new customers, but no split between pricing, contraction and attrition is disclosed, no customer count has been published since FY2022, no revenue bridge separates price from volume in any period, and no account is named anywhere as won from or lost to a competitor.
The contested revenue base is unmeasured from outside. No filing discloses revenue by market-legality status and no period shows revenue actually lost on that basis. The short reports themselves and the company's April 28 Form 6-K response are not in the corpus, so both the allegations and the rebuttal are known only second-hand. In most European jurisdictions the company's business-to-business supply requires no licence, so no external party can test a European client list against a supervisory register [74]. The drop-through on any lost revenue is also undisclosed: the honest band runs from 23.0% to 100%, which moves the implied permanent revenue loss on the event window from 13.78% to 3.17%.
Consensus exists in one vintage. The panel was updated 2026-07-23, three months after the event, with no revision-history fields, so the before-and-after consensus delta is not computable and the unchanged March and April guidance tables are used as the substitute. Coverage thins sharply — 21 estimates at FY2027, 12-13 at FY2028, two at FY2029 — and no estimate count or share-based compensation estimate is published for the free-cash-flow line at any year.
There is no post-event operating observation. The last reported period ended March 31, 2026, three weeks before the reports; the first test is August 3, 2026.
Positioning and peer context could not be run. Short interest is unavailable in every file, so days-to-cover and any change in positioning around April 22 are not computable. No peer or index price series exists, so the 14.47% pre-event drift could not be tested against a sector move. External web research was unavailable this pass — the research provider returned an insufficient-credit error on three attempts — so nothing beyond the corpus could confirm the drift's cause. The share of the recovery attributable to the company's own repurchases cannot be separated either: a $250m enhanced programme was announced on the trough session and €91m ran in Q1 alone, with no daily or monthly execution disclosure.
Instrument data is thin at the tenor that qualifies. No reachable dated source published open interest or bid/ask for the January 2028 or July 2027 expiries, no implied-volatility rank or percentile history was retrievable, and no term-structure point between 30 and 180 days was available, so the band judgment rests on two point observations dated 2026-07-27 with results six days out.
Two share-count ambiguities remain open. No share count is published for any date after December 31, 2025, and roughly 6-7 million further shares are implied retired since — about 2% of the count, which would raise every yield here by about 2% relative. And the FY2025 Item 16E table is internally inconsistent: the column header attributes 4,130,572 shares to the announced programme while its own footnote states the same 4,130,572 were purchased outside any programme. The narrative and Note 19.3 reading is used here; a reader taking the footnote literally would conclude that essentially none of FY2025's repurchases were programme purchases [75].
Two structural absences, recorded as such. No roll-forward of the sport-rights licence payable is disclosed, so the FY2025 increase cannot be split cleanly between obligations assumed with the IMG ARENA acquisition and obligations newly incurred. And no filing confirms execution of the chief executive's stated intention to purchase $10 million of shares personally, nor could one be expected: directors and officers had no Section 16(a) obligation until March 18, 2026.
Checked and unremarkable
No scout memo closed as routine or empty in this run. All eight — accounting and cash quality, business economics, capital allocation, competition and moat, history and track record, industry, people and governance, and valuation and expectations — returned load-bearing findings, and each is carried at full strength in the evidence chapters rather than summarised here.
Playbook version
Rendered against playbook fcf-dislocation, version 4, as frozen for this run.
Rights and Data Layer
Sportradar Group AG occupies one narrow link in the sports betting chain. It buys the exclusive right to collect and distribute official data and video from sports leagues, and it sells that feed — together with the odds, the screens and the trading services built on top of it — to the bookmakers who take the bets. Revenue in the year to December 2025 was €1,290.0 million [1], earned in over 120 countries [2]. Two features of the link it occupies shape everything that follows: the price of its main input is set by monopoly rightsholders on multi-year cycles, and the customers it sells to are, across most of Europe, not certified as lawful by any regulator that also looks at Sportradar.
FY2025 Revenue (€m)
FY2025 Revenue Growth
Sport Rights Cost / Revenue
Top 200 Clients / Revenue
Sources: revenue and growth from reported financials, FY2025 Form 20-F revenue by product group [3]; sport rights share derived from €404.3 million of sport rights expense against reported revenue [4]; client concentration from Our Clients [5].
Between the league and the bookmaker
A sports bet moves money along a short chain, and every participant in it earns from a different point. At the top sits the rightsholder — a league, a federation, a tournament organiser — which owns the event and can therefore sell the exclusive right to distribute what happens inside it, ball by ball, in real time. At the bottom sits the bettor. In between sit two commercial layers: the betting operator that takes the wager and carries the risk, and the supplier layer that gives the operator the data, the prices and the software to run the book at all.
Sportradar is in the supplier layer, and it has bought its way to the top of the chain. Its exclusive partnerships include the NBA, MLB, the NHL, the PGA Tour, MLS, the ATP, FIFA, CONMEBOL, UEFA, the AFC and the DFL, with tennis rights running through the USTA, the French Tennis Federation and the All England Club as well [6]. Downstream it sells to Bet365, Caesars, DraftKings, Entain, FanDuel, Flutter and William Hill, to broadcasters including CBS Sports, ESPN, Fox Sports and Rogers Media, and to Apple, OpenAI, Meta, Google and Amazon; it holds relationships with over 400 leagues and federations. Its top ten clients were 27% of FY2025 revenue and its top 200 about 79% [7].
Three terms recur throughout this report and are worth fixing here. Gross gaming revenue, or GGR, is what bettors lose — stakes placed less winnings paid out — before any tax or promotional cost. Net gaming revenue, or NGR, is GGR after gaming duties and certain player incentives such as free bets have been deducted; it is the smaller number, and the gap between the two is set by governments. In-play betting is wagering on events inside a live match rather than on the final result; it already accounts for the majority of gross gaming revenue in the more developed European markets, and it is the form of betting that cannot exist without a low-latency official data feed [8]. That last point is the commercial reason this layer exists at all: a bookmaker cannot price the next corner kick from a television picture.
Source: FY2025 Annual Report (Form 20-F), revenue split by product groups [9].
Four fifths of the business is betting. Betting and Gaming Content — the data feeds, pre-match and live odds, streaming and engagement tools — was €817.3 million in FY2025; Managed Betting Services, where Sportradar runs the trading desk on the operator's behalf, was €229.8 million. The remaining €242.9 million sits in Sports Content, Technology and Services: affiliate and advertising work, performance analytics sold back to teams, and integrity monitoring sold to federations [10].
Contracts in the betting half take one of two forms. Either a fixed-fee recurring arrangement — a guaranteed minimum for a set number of events, with per-event fees above it — or a variable revenue share struck as a percentage of the client's gross gaming revenue, typically also with a minimum guarantee underneath [11]. The FY2025 Form 20-F quantifies the split: 67% of total revenue was generated from fixed-fee recurring arrangements and the remaining 33% from revenue sharing arrangements, against 68% and 32% in FY2024 [12]. So roughly a third of the revenue base moves with how much bettors lose to Sportradar's customers.
The largest cost is the mirror image of the largest asset. Sport rights expense, including amortization of the capitalized licences, was €404.3 million in FY2025, up 15% on the prior year [13]. That is 31% of revenue paid to a set of counterparties each of which is, for its own competition, the only possible seller. What that bill does to the shape of the business is the subject of the next act; what matters here is that the input price in this layer is not set by a market.
The pool everyone in the layer draws from
Sportradar sizes its own demand pool using H2 Gambling Capital's global summary of January 2026: a global sports betting market of $127.1 billion in 2025 growing to $192.7 billion in 2030, a compound rate of 9%. Inside that, the mature markets — the United Kingdom, Italy, Australia, much of Europe and Asia Pacific — are forecast to add about 5% a year, while the United States runs from $19.7 billion to $35.7 billion at 13% and Africa grows fastest of any continent at 14%. Europe and Asia together are still expected to be about 61% of the 2030 revenue pool. Thirty-nine states and the District of Columbia have legalized sports betting and thirty-two plus DC have legalized it online, per Vixio's January 2026 outlook [14].
Source: H2 Gambling Capital Global Gaming Data Summary dated January 15, 2026, as cited in the FY2025 Annual Report (Form 20-F) [15].
Two qualifications belong with those numbers. The first is that the growth is not in the markets where most of the money currently is: the developed markets that dominate today's pool are the 5% line, and the double-digit rates attach to territories being legalized. The second is provenance. Neither the H2 report nor the Vixio outlook is in the public record here; both are known only as quoted by the companies that bought them. That said, they are quoted by more than one company. Kambi, a rival supplier one layer down the chain, independently cites Vixio for European regulated online sports betting gross gaming revenue rising from roughly €15.2 billion in 2024 to about €20.2 billion by 2028, and points to Finland's multi-licence regime from July 2027 as the next opening [16]. The suppliers in this industry are working from the same two forecasters.
Where the money pooled in 2025
An industry compounding at 9% does not lift every layer of it. FY2025 separated the value chain sharply, and the separation is visible in the four suppliers whose own filings and calls are on the record.
Sources: Sportradar revenue and growth from reported financials and the FY2025 Form 20-F [17]; Genius Sports group revenue [18] and growth [19]; Kambi revenue [20] and decline [21]; Better Collective revenue, growth derived from reported figures [22].
The two companies that own official rights grew; the two that sell services around them did not — a comparison The Barrier and the Bill takes up at full strength, where the deceleration diagnosis needs it.
Two cautions belong with that table. The four companies do not all report in the same currency, and Genius Sports reports in dollars while the other three report in euros, so a weak dollar year flatters the comparison in one direction and penalizes it in the other. And the run's normalized peer scoreboard did not load, so every peer figure above was read off that company's own filing or transcript rather than a common series. The direction of the divergence is well supported; its precise magnitude is not.
The deduction that happens before the invoice
The clearest teaching of how government tax policy reaches a supplier in this industry comes not from Sportradar but from Kambi, because Kambi's contract is written on the far side of the deduction. Kambi charges commission on its operators' net gaming revenue — GGR less deductible costs, principally capped player incentives and tax. In 2025, 98% of its operators' GGR was subject to betting duties in locally regulated markets, up from 94% in 2024, and the year's gaming-related taxes plus additional player-incentive deductions cut those operators' NGR by 13% [23]. A tax rise in that structure is not a demand event. It is an arithmetic one: the base the commission is calculated on shrinks the moment the duty changes, before any bettor changes behaviour.
The named causes are specific and dated. Kambi points to Dutch deposit limits and higher Dutch gaming taxes, and to planned rises in UK remote gaming duty and general betting duty as further pressure on partners in a key market [24]. Better Collective, from a different layer entirely, attributes its own rebasing to Brazil's regulatory transition, which cost approximately €22 million of 2025 bottom line against a previously communicated €35–55 million, and notes that 100% of group revenue is now generated in regulated markets [25]. Two independent suppliers, two layers apart, describe the same force.
Sportradar's exposure to that force runs through a different door, and the distinction is worth holding precisely. Its variable contracts are struck as a share of the client's gross gaming revenue, not net [26], so a duty increase does not shrink Sportradar's base by definition the way it shrinks Kambi's. It reaches Sportradar one step later, through what the operator does next: cutting promotional spend, pulling out of a market, or losing volume to whoever is not paying the duty. The 20-F states the transmission mechanism in its own words — if the regulatory environment becomes unfavourable or unfeasible for clients to keep offering sports betting in a jurisdiction, the result is market closure and lost revenue "due to a decreased demand for our products and services" [27]. Roughly a third of the revenue base sits on client gaming revenue [28]. The compression is real and it is second-order; it is behavioural rather than definitional, and it arrives with a lag.
The licence Europe does not require
European gambling law was written to protect the person placing the bet. Because its overriding purpose is consumer protection, it addresses the supply of betting products to end consumers — and Sportradar has no end consumers. Its business is conducted solely business-to-business, and so, in the company's own description, "most European betting laws do not cover the provision of such supply services to the betting industry on a B2B-basis and thus, in most European jurisdictions, our business is not subject to holding a license." Only a few European jurisdictions license B2B suppliers at all. Where none is required, Sportradar operates on approvals or certifications from the relevant authority, on agreements in which the client warrants that its own consumer-facing offer complies with local law, and on due diligence checks Sportradar performs on its clients' licensing status [29].
The United States is the opposite arrangement. There, Sportradar is directly and extensively regulated under federal, state, local and tribal regimes, must maintain its licences to keep operating, and is subject to review of the character and financial stability of its owners, managers and directors — with the further feature that a violation in one jurisdiction can trigger disciplinary action in others [30].
Source: FY2025 Annual Report (Form 20-F), Regulation and Licensing — European laws and regulations [31] and U.S. laws and regulations [32].
The practical difference is a difference in what an outsider can check. In an American state there is a licence, a register and a regulator with the power to act on what it finds. In most of Europe the record that a given customer was lawful consists of a representation inside a commercial contract and a diligence file inside the supplier — both private documents, neither of which anyone outside the company has ever seen.
That the industry's gray and black markets are large enough to matter is not only Sportradar's characterization of its own risk. Kambi's chief executive, discussing a business he distinguishes explicitly from a data supplier's, describes Kambi as "one of very, very few B2B sports betting operators, while still many are only focused on black/gray markets," says its regulated-only footprint is what made wins with PMU, Ontario Lottery and Gaming, British Columbia and Atlantic Lottery possible — "we would have no chance to win one of these deals having still a big gray market footprint" — and notes that as a turnkey platform "we can't hide anything," specifically because of the transparency Nevada licensing demands [33]. A gray market here means a jurisdiction where online betting is neither expressly licensed nor clearly prohibited; a black market means supply in defiance of a prohibition or without a licence the jurisdiction requires. The distinction matters later, because the parties arguing about Sportradar do not all draw the line in the same place.
November 2025: the layer narrows
On November 1, 2025, Sportradar acquired 100% of IMG ARENA, the sports betting rights business of Endeavor, and its global rights portfolio. It paid nothing at closing. Instead the transaction carried total financial consideration of $225 million running toward Sportradar: $100 million payable to Sportradar in equal instalments on the first and second anniversaries of closing, plus up to $125 million of cash prepayments made by the seller to certain sport rightsholders — settled before the acquisition, and therefore recorded as a reduction in the liabilities Sportradar assumed rather than as purchase consideration [34].
Assets acquired (€m)
Liabilities assumed (€m)
of which trade payables (€m)
Consideration transferred (€m)
Source: FY2025 Annual Report (Form 20-F), Note 3 preliminary purchase price allocation for IMG ARENA [35].
The purchase price allocation says what the seller was escaping. Sportradar took on €370.0 million of assets — €305.2 million of it intangible, which is to say the rights themselves — against €516.4 million of liabilities, of which €472.5 million was trade payables, current and non-current. Net liabilities assumed were €146.4 million, goodwill €74.0 million, and consideration transferred was negative €72.4 million [36]. In this industry, "trade payables" of that size are the unpaid licence bill owed to rightsholders. So the transaction is a clean read on one thing: a portfolio of exclusive league rights, held by a well-capitalized owner, was worth less than nothing once the obligations attached to it travelled with it. The UK's Competition and Markets Authority cleared the deal unconditionally, accepting the rarely-granted counterfactual that IMG ARENA would otherwise have exited the market [37].
The company's own list of named competitors registers the change. It did not shorten — one name was replaced.
Sources: FY2021 Annual Report (Form 20-F), Our Competition [38]; FY2024 Annual Report (Form 20-F), Our Competition [39]; FY2025 Annual Report (Form 20-F), Our Competition [40].
IMG Arena was named as one of four primary competitors in every annual report from the IPO year through FY2024 [41] [42]. In FY2025 it is gone, and Infront Sports and Media stands in its place [43]. The evidence supports a narrower claim than "a duopoly": Sportradar and Genius Sports are the two suppliers on this record with disclosed revenue at scale and rights portfolios that span the stack. No market-share figure for anyone in this layer exists in the record, and Stats Perform, Infront and BetConstruct file nothing here, so the census is a list of names rather than a measured structure. What is measured is the transaction price, and it says that running a sub-scale rights book against these obligations was not viable for the party that tried.
The number that cannot be computed from outside
Which leaves the question of how much of the demand in this layer nobody regulates — and the honest answer is that the public record cannot settle it.
Sportradar's figure is bottom-up. Asked directly on the Q1 2026 call to quantify revenue from operators in illegal markets, the chief executive gave a range: "it's a low to mid-single-digit number, so 5% to 12%, 13%. That's the range which we have, and we are drilling this down from our operational business" [44]. The chief financial officer then walked the arithmetic an outsider could reconstruct: Sports Content, Technology and Services is a little over 20% of revenue and is not betting-related; within the other 78%, the primary exposure sits in the data and odds business rather than in the fan-engagement and audiovisual streaming products; strip those out, apply published gray-market estimates to what remains, "and you can see that the math takes you back down to that low to mid-single-digit exposure" [45] [46].
Set against that, on April 22, 2026, Muddy Waters and Callisto Research published reports estimating that 20–40% of Sportradar's revenue came from illegal operators; the shares fell 22.6% in the following session [47]. And set against both, a rival supplier says without being asked about Sportradar at all that many B2B suppliers in this industry focus only on black and gray markets [48].
Four features of this record make the gap between 5% and 40% unresolvable from outside it, and they are structural rather than evidentiary.
The first is the perimeter. Across most of Europe no regulator licenses Sportradar's B2B activity [49], so there is no supervisory file, no public register and no examination report against which an outsider could test a client list. The second is the client list itself: Sportradar names its marquee accounts and discloses concentration percentages, but not the tail — and on any version of this story the disputed revenue sits in the tail rather than among Bet365 and FanDuel [50]. The third is method: the company's own estimate is explicitly built client by client from operational data that is commercially confidential [51], so it cannot be reproduced from a filing. The fourth is definitional. The three parties are not counting the same thing: the chief executive's answer folds gray and black together, Kambi's chief executive separates them, and the short sellers' term is "illegal operators". Neither short report is in this record — the 20–40% estimate is known here only through news coverage of it.
That is the shape of the disagreement. It is not a case where one side has published a number the other has failed to rebut; it is a case where the measurement surface an outsider would use does not exist, by construction, in the part of the world where most of the disputed revenue would sit.
What the rest of this report examines
Sportradar is a rights-and-data supplier that has bought exclusivity from monopoly sports leagues on €1,529.2 million of licence fee payables carried inside trade payables rather than borrowings [52], and that now owns a layer which narrowed to two after a rival's rights book changed hands at negative consideration [53]. It trades 25% off its three-year high and 46% below its 2021 IPO price of $27.00 [54] on 2.3 times the revenue it earned that year, because two short sellers put a number on the share of its customers that no regulator licenses — while growth has stepped down to 16.6%, the retention metric sits at its lowest disclosed reading of 109% against 127% a year earlier [55], and the founder's Class B voting control converts automatically on September 30, 2028 [56].
Each of those clauses is a chapter. The first of them is the bill: what it costs to keep the exclusivity that made this layer narrow, how it is paid for, and where on the balance sheet it is recorded.
Rights Bought on Credit
A sports data licence is bought once and sold many times. Sportradar signs a multi-year exclusive with a league, capitalises the contracted minimum payments as an intangible asset, amortises them straight-line over the seasons the deal covers, and then resells the same feed to every bookmaker that wants it. The cost of the licence does not rise with the number of customers attached to it. That is the arbitrage, and it is why the shape of this company's profit and loss is governed by two lines: what the leagues charge, and everything else.
The financing of that arbitrage is the part that does not appear where an investor would look for it. At December 31, 2025 Sportradar owed rightsholders €1,529.2 million in licence fee payables — an interest-bearing, mostly dollar-denominated obligation recorded inside trade payables [1]. Its loans and borrowings on the same date were €62.9 million, all of it lease liabilities [2].
Licence Fee Payables (€m)
Total Equity (€m)
Interest Accrued on Payables (€m)
Loans and Borrowings (€m)
Sources: FY2025 Annual Report (Form 20-F), Note 22 Trade and other payables [3]; Note 20 Loans and borrowings [4]; consolidated statements of financial position [5]; Note 10 Finance costs [6].
One purchase, many resales
The revenue side of the arbitrage is contractual and mostly time-based. Client contracts take one of two forms — fixed-fee recurring or variable revenue share (Rights and Data Layer). Recurring contracts run one to five years, and the minimum guarantee is recognised straight-line across the life of the contract while the variable fees are recognised as earned [7].
The split between the two is disclosed, and it has drifted one way for three years.
Sources: FY2025 Annual Report (Form 20-F), Costs and expenses — revenue arrangements [8]; FY2023 Annual Report (Form 20-F), Our Customers and Business Model — the 69.4% fixed-fee share [9].
The mechanics inside each form matter more than the ratio. Stand-ready services — the data feed itself, the betting entertainment tools, the audiovisual product — are billed in advance, monthly or quarterly. Managed betting services, virtual gaming, media and advertising are billed in arrears. Payment terms across the book are typically net 10 days [10]. A supplier that collects in ten days and pays its own suppliers over years has a working capital profile that runs in its favour before anything else happens.
On the variable third, the accounting is asymmetric in a way that flatters reported revenue and understates the risk carried. Revenue share on live betting is variable consideration that is constrained — not recognised at all until the client has itself generated gaming revenue from the individual bet [11]. But the exposure runs both ways in managed trading. Sportradar's Managed Trading Services fee is the higher of an agreed minimum and a share of the client's gaming revenue, and most MTS contracts also carry a loss participation clause: where the client's gross or net gaming revenue is negative, Sportradar absorbs a share of that loss at the same percentage it would have earned [12].
That clause is not theoretical. In the first quarter of 2026, Managed Betting Services revenue fell 2% year on year: trading turnover was higher, and unfavourable sporting outcomes took the difference back [13]. A third of this revenue base is, in the end, a position on how favourites perform.
The take-rate ladder
Management's stated price mechanism is not a list price. It is take rate — Sportradar's revenue expressed as a percentage of the client's gross gaming revenue — and it rises as the client buys further up the product stack.
Source: Investor Day 2025 presentation, illustrative GGR mix across the Sportradar betting value chain [14]. These are illustrative investor-day figures, not disclosed metrics reconciled to reported revenue.
The arithmetic the company puts behind that ladder is worth walking, because it is the clearest available statement of how the same customer becomes worth more without spending more. Holding a client's gross gaming revenue constant at $100 million while its mix shifts from pre-match toward in-play and outsourced trading roughly doubles Sportradar's revenue from that client.
Source: Investor Day 2025 presentation, illustrative GGR mix across the Sportradar betting value chain; revenue columns are the presentation's take rates applied to its GGR mix [15].
Total revenue on the same $100 million of client gross gaming revenue moves from $2.0 million to $4.1 million. The volume driver underneath it is the migration to in-play betting, which the company put at 33% of United States gross gaming revenue in 2024, rising to 44% by 2027 and 47% by 2029; by 2029, on its own estimate, each additional percentage point of in-play share is worth about €6 million a year of revenue to Sportradar [16]. Neither figure is restated in any filing, and neither is reconciled to reported revenue — they are the company's framework for its own growth, not an audited measure.
The cost architecture
The margin question in this business is narrower than it looks, because only one cost line is genuinely fixed against the revenue it supports, and it is the one nobody controls. Laid out as a share of revenue, the cost base shows an unambiguous pattern.
Source: Q4 and FY2025 earnings presentation, cost profile and drivers of operating leverage [17]; the FY2023 to FY2025 columns reconcile to the adjusted expense tables in the FY2025 Annual Report (Form 20-F) [18].
Everything that is not sport rights fell from 57% of revenue in FY2022 and FY2023 to 48% and then 46% [19]. The company's own adjusted expense reconciliation confirms it: adjusted personnel expenses of €310.8 million, adjusted purchased services of €173.7 million and adjusted other operating expenses of €104.3 million sum to €588.9 million, or 45.6% of the €1,290.0 million of FY2025 revenue [20]. Sport rights went the other way — 26%, 24%, 32%, 31% — as the current licence cycle was signed [21]. Adjusted EBITDA margin moved from 19.0% in FY2023 to 20.1% in FY2024 to 23.0% in FY2025 [22].
In absolute terms the two largest costs are now within €2.1 million of each other. Sport rights expense was €404.3 million in FY2025 and personnel expenses €402.2 million, against purchased services of €190.9 million and other operating expenses of €146.0 million [23]. The rights line splits into €270.2 million of amortisation of capitalised licences and €134.2 million of non-capitalised rights expensed as incurred; two years earlier those two figures were €160.0 million and €54.2 million [24].
The consequence is specific. Margin expansion here is not a cost line falling; it is a rights bill contracted years ago being spread over a revenue base that has grown faster than it. That works while revenue outruns the bill and stops working when it does not — which is the arithmetic the next act sets against the FY2025 growth step-down.
Capital intensity as rights
What Sportradar calls capital expenditure is not servers and offices. FY2025 capital expenditure was €228.3 million, essentially flat on FY2024's €227.7 million [25]. Against revenue it has fallen from 23.3% in FY2021, when capital expenditure was €130.8 million [26], to 17.7% in FY2025 — not because the company spends less, but because revenue grew faster than the cash outlay did.
Inside the intangible additions, the mix is stark: €353.8 million of licences against €46.7 million of internally-developed software [27]. Licences carry a net book value of €1,466.7 million, 72% of the €2,033.7 million of intangible assets and goodwill on the balance sheet [28]. And within that licence balance the deployment is concentrated in six decisions: Major League Baseball, the Deutsche Fußball Liga, the NBA, the NHL, UTR Sports and the ATP together carry €1,020 million of net book value, 70% of the total, with a weighted-average remaining useful life of 5.6 years against 3.7 years for everything else [29].
Reinvestment in this business is therefore not incremental. It is a handful of league renewals, negotiated years apart, each large enough to move the cost base of the whole company for half a decade. What that renewal clock implies for the next negotiating round belongs to the chapter that follows.
The obligation outside borrowings
The licences are bought on the leagues' credit. At initial recognition, the licence asset is measured at the present value of the contractually agreed and in-substance fixed minimum payments over the non-cancellable term, discounted at the company's incremental borrowing rate plus a country risk premium [30]. The offsetting liability is a licence fee payable, and it is presented inside trade payables.
Sources: FY2025 Annual Report (Form 20-F), Note 22 Trade and other payables [31]; FY2023 Annual Report (Form 20-F), Note 23 Trade payables [32]; interest from Note 10 Finance costs [33].
The balance was €413.2 million at the end of 2022. It reached €1,110.5 million a year later as the current rights cycle was signed [34], eased to €1,074.0 million through 2024, and rose to €1,529.2 million at December 31, 2025 — €319.4 million current and €1,209.9 million non-current [35]. Total equity on that date was €978.3 million [36].
It carries interest. Accrued interest on licence fee payables was €80.6 million in FY2025, up from €71.9 million in FY2024 and €27.4 million in FY2023 — 93% of the €86.5 million total finance cost, with lease interest of €5.7 million making up almost all the rest [37]. Cash interest paid was €85.6 million, against €76.4 million in FY2024 and €30.5 million in FY2023, and it is deducted inside net cash from operating activities [38].
The discount rate itself is not disclosed. An implied average rate can be computed from the two figures that are.
Source: derived from reported figures — accrued interest on licence fee payables divided by the average of opening and closing payable balances, FY2023 and FY2025 Annual Reports (Form 20-F) [39] [40].
Interest accrued over the average balance implies roughly 6.2% in FY2025 and 6.6% in FY2024. That is a corporate borrowing rate, and it is paid to sports leagues rather than to lenders.
The maturity table supplies the other half of the picture. Undiscounted contractual cash flows on trade payables total €1,902.0 million — €437.2 million due within a year, €1,264.3 million in one to five years, €200.5 million after five [41]. Against the €1,636.7 million of trade and other payables carried on the balance sheet [42], that is €265.3 million more cash to be handed over than is currently recognised as a liability — the discount that will unwind through finance cost over the remaining licence terms. A year earlier the same gap was €196.1 million [43].
None of this appears in the leverage line. Every quarterly results release from the third quarter of 2024 onward has described the balance sheet the same way: total liquidity, an undrawn credit facility, "and no debt outstanding" [44]. On the conventional definition that is accurate: loans and borrowings are €62.9 million of lease liabilities, the €220.0 million revolving credit facility is undrawn, and net debt in the reported financials is minus €313.5 million. The company also discloses, in the same document, that its liquidity is required "to service the above license payment commitments" [45]. Both statements are in the record; they simply do not sit in the same part of it.
An unhedged dollar bill
Licence payments are made primarily in United States dollars [46]. The company reports in euros, and it did not use derivative financial instruments to hedge exposures arising from its non-euro obligations in 2023, 2024 or 2025 [47].
The result is that the euro carrying value of a dollar-denominated liability of roughly €1.5 billion is revalued through the income statement every period, and by FY2025 that revaluation had become the largest single component of reported profit. Foreign currency gains of €184.1 million against losses of €105.3 million produced a net gain of €78.8 million, which management attributes to the depreciation of the dollar against the euro on trade payables related to sport rights licences [48] [49]. The comparable line in FY2024 was a €38.2 million loss. The €117.0 million swing between the two years is larger than the €66.7 million by which profit for the year increased [50].
The first quarter of 2026 shows the same mechanism running the other way, which is the cleanest available evidence that the line is a revaluation and not earnings.
Source: Q1 FY2026 results release, condensed consolidated statements of profit or loss [51].
Revenue rose 11% to €346.5 million and adjusted EBITDA rose to €66.0 million at a 19.0% margin against 18.9% a year earlier [52]. The foreign currency line went from a €27.5 million gain to a €9.3 million loss, and the €24.3 million profit of the prior-year quarter became a €6.3 million loss [53]. The company describes the driver as unrealised currency movements, principally on dollar-denominated sports rights [54].
The record does not disclose how much of the FY2025 gain was realised and how much was a translation of a balance not yet settled, so the cash content of the largest single component of that year's profit cannot be isolated from the filings.
The distance between the two profit numbers
Sportradar reports two measures of profitability and the gap between them was 15.2 points of margin in FY2025: adjusted EBITDA of €296.8 million, 23.0% of revenue, against profit for the year of €100.3 million, 7.8% [55].
Source: FY2025 Annual Report (Form 20-F), reconciliation of Adjusted EBITDA to profit for the year from continuing operations; the non-recurring row aggregates the separately presented restructuring, non-routine litigation, transaction-related, secondary offering, impairment, equity-accounted investee and professional-fee add-backs [56].
Three features of that bridge are worth stating plainly. The €196.5 million of reconciling items includes €78.8 million that is a gain being removed rather than a cost being added back — so the adjusted measure is, in this respect, more conservative than the statutory one. Share-based compensation of €56.1 million is 4.4% of revenue and the largest of the three years presented, up by half on the €37.8 million of FY2024. And the €57.7 million of items presented as non-recurring — restructuring, non-routine litigation, transaction and secondary offering costs, impairments — has a counterpart in each of the three years disclosed: €5.2 million in FY2024 and €35.9 million in FY2023 [57]. A category that appears every year is a cost with a variable amount, not an absence of cost.
One choice runs the other way, and it is the more important one. Adjusted EBITDA does not add back the €270.2 million of amortisation of capitalised sport rights. Management states the reason explicitly: whether a licence is capitalised at all turns mainly on its contracted length, so excluding the amortisation would make the metric depend on contract structure rather than on economics [58]. On the most consequential presentational choice available to it, the company took the harder option.
Cash, and the gap between signing and paying
Net cash from operating activities was €403.0 million in FY2025 against adjusted EBITDA of €296.8 million — an operating cash flow larger than the earnings measure it is meant to convert from [59]. The mechanism is structural rather than exceptional. The €270.2 million of rights amortisation that depresses statutory earnings is non-cash in the year it is charged; the cash for those rights left, or will leave, in a different period and through a different statement. Rights interest of €85.6 million is deducted inside operating cash flow. Rights principal is settled through investing activities, where "acquisition of intangible assets" of €223.4 million is described in each quarterly release as payments related to sport rights licences [60] [61].
Two free cash flow figures are in circulation and both are disclosed. The company's own measure is €167.2 million, which deducts €7.6 million of lease principal on top of capital expenditure; a conventional operating-cash-flow-less-capex basis gives €174.7 million, or 13.5% of revenue.
The more revealing comparison is between the rights acquired in a year and the rights paid for in that year.
Sources: FY2025 Annual Report (Form 20-F), Note 13 Intangible assets and goodwill cost roll-forward [62]; FY2023 Annual Report (Form 20-F), Note 13 Intangible assets and goodwill [63]; consolidated statements of cash flows [64].
The pattern is visible across three years. FY2023 was the signing year: €1,023.5 million of licences were added to the balance sheet against €185.5 million of cash paid for intangible assets [65] [66]. That is the transaction that took the licence payable from €413.2 million to €1,110.5 million in a single year, and it is the reason accrued interest on the payable went from €27.4 million to €71.9 million the year after.
FY2025 repeated the shape at smaller scale. Sportradar added €353.8 million of licences by purchase and a further €302.4 million through the IMG ARENA acquisition — €656.2 million of licence intangibles in one year — while paying €223.4 million of cash for intangible assets [67] [68]. Of the purchased additions, €259.1 million was unpaid and recognised as a liability at year end, against €73.0 million a year earlier, and a further €34.2 million was settled not in cash but by granting equity instruments to a licensor [69]. During the same year the company settled €134.5 million of prior years' licence liabilities, against €161.4 million in FY2024 and €143.1 million in FY2023 [70].
So free cash flow rose to its highest reported level in a year when the share of rights acquired without cash rose sharply. That is a timing relationship, not an accounting irregularity — the obligations are on the balance sheet, disclosed, and interest-bearing. But the timing has a maturity. The current portion of licence fee payables rose from €178.3 million to €319.4 million, an increase of €141.1 million in cash falling due inside twelve months [71].
One further line moved during the year and is easy to miss. Commitments held outside the balance sheet fell from €301.0 million to €233.5 million, and within that, commitments for licences not yet capitalised went from €142.2 million to nil [72]. That block did not disappear; it moved onto the balance sheet, and it is part of why the payable grew.
The price of IMG ARENA
The acquisition that narrowed this layer was settled with no financial consideration paid at closing, on the terms set out in Rights and Data Layer; the seller's prepayments to rightsholders reduced the liabilities Sportradar assumed and are therefore not recognised anywhere in its accounts [73].
What Sportradar did assume was €472.5 million of trade payables — €122.4 million current and €350.1 million non-current — against €305.2 million of intangible assets acquired [74]. The true price of the transaction is that obligation. It does not appear in the cash flow statement, where the acquisition produced a €4.7 million net inflow [75]. It will appear over the next several years as amortisation of the €302.4 million of acquired licences and as interest unwinding on the assumed payable.
The filings do not provide a roll-forward of the licence fee payable, so the €455.2 million increase during FY2025 cannot be decomposed exactly. The disclosed components point the same way: €259.1 million of unpaid new additions and €472.5 million of trade payables assumed with IMG ARENA, less €134.5 million of prior-year settlements and the translation effect of a weaker dollar on a dollar-denominated balance. The purchase price allocation is stated to be preliminary and subject to revision within a year of closing [76].
What the arbitrage now requires
The business buys long-dated exclusivity from counterparties that face no competing seller, pays for it over years at an implied rate above 6%, in a currency it does not hedge, and records the obligation among the payables a reader would associate with unpaid invoices. Against that it collects from customers in ten days, spreads a fixed rights bill across a growing revenue base, and converts more than half of its adjusted earnings into free cash. Both halves of that description are drawn from the same set of audited statements.
The arbitrage holds while revenue grows faster than the rights bill. In FY2025 it did: revenue up 16.6% on the reported financials against sport rights expense up 15%, and adjusted EBITDA margin up 2.9 points [77] [78]. It held by a narrower margin than before: 16.6% is the slowest annual revenue growth since 2020, on a rights book whose six largest licences have 5.6 years left to run before they must be bought again. What that exclusivity actually purchased — measured in growth delivered, customers retained and obligations incurred — is the next question.
The Barrier and the Bill
The FY2025 Form 20-F makes the case for the moat in one sentence. The expansive network, the data-collecting infrastructure and the scale of two decades of historical data are, in the company's own words, "a significant barrier to our competitors" [1]. A page later it adds the second half of the claim: clients are "deeply integrated with us from an operational and technology perspective, making it difficult for them to switch providers and serving as a strong barrier to entry" [2].
Both halves are testable against numbers the company publishes itself. FY2025 is the year several of them moved the other way.
FY2025 Revenue Growth
Customer Net Retention
Sport Rights / Revenue
Licence Fee Payables (€m)
Sources: revenue growth derived from reported financials, FY2023–FY2025 revenue as filed [3]; Customer Net Retention Rate and sport rights share from the FY2025 Form 20-F [4] and Note 6 [5]; licence fee payables from Note 22 [6].
A step down in the top line
Revenue grew 16.6% in FY2025, against an average of 25.5% across the three preceding fiscal years. That is the largest single break in the multi-year record, and it is the number the rest of this chapter is built to explain.
Source: derived from reported revenue, FY2020–FY2025 as filed [7]; [8].
Two things sit inside that 16.6%, and they push in opposite directions.
The first is acquisition. IMG ARENA closed on November 1, 2025 and contributed €28.0 million of revenue and €1.3 million of net profit in the two months Sportradar owned it [9]. Strip that out and the underlying rate on the prior-year base is 14.0%. Content growth in the fourth quarter was explicitly attributed in part to the acquired rights: Betting and Gaming Content rose 29% in Q4 against 16% for the full year, with IMG ARENA named among the drivers [10]. So the reported figure flatters the organic rate by roughly two and a half points, in the same year that the acquisition brought its own obligations onto the balance sheet.
The second is currency, and it runs the other way. Sportradar reports in euros and sells a material share of its product in dollars; management describes the dollar-euro move as a headwind through FY2025 and quantifies it for the following quarter, where 11% reported revenue growth was 16% on a constant-currency basis [11]. The corpus does not give the equivalent full-year FX bridge for FY2025, so the constant-currency organic rate cannot be pinned. What can be said is that the FY2025 deceleration is partly translation and partly real, and that the acquired-content contribution offsets some of the translation drag in the reported number.
The comparison that gives the deceleration its edge is not against Sportradar's own history. It is against the one supplier that collides with it across the whole stack.
Sources: Sportradar revenue as filed [12]; Genius Sports revenue, growth and the cited market growth rate from its Q4 FY2025 earnings call [13]; [14].
Genius Sports reported group revenue of $669 million for FY2025 at 31% growth — "our strongest annual increase since 2021" — with a full-year 20% EBITDA margin its management called "our highest annual margin" [15]. It benchmarked that against "the 24% growth of global online sports betting GGR" in 2025 [16]. On the numbers each company published, one supplier in this layer grew above the end-market rate it cites and the other grew below it.
That comparison needs three caveats stated at full strength, because it is doing a lot of work. The two companies report in different currencies and neither discloses a like-for-like constant-currency figure the other can be measured against. Genius Sports' figures here come from earnings-call transcripts rather than an audited filing — the two annual reports filed under the GENI ticker in this corpus belong to a UK cardiovascular-genetics company that shares the ticker, so no Genius balance sheet or audited income statement exists in the record. And the mixes differ: Genius Sports' media business grew 37% to $144 million on a second half that nearly doubled against a soft comparison period, with management warning that rate would not continue [17]. The gap is directional, not decomposable.
The one expansion metric on the page
The company discloses exactly one measure of how much more its existing customers buy from it each year. Customer Net Retention Rate takes the trailing-twelve-month revenue of the top 200 clients as of twelve months earlier, recalculates the same cohort's revenue at the current period end — including upsells, net of contraction and attrition, excluding any revenue from new customers — and divides one by the other [18]. A reading of 109% means the base grew by nine points on its own, before a single new logo.
Sources: FY2021 Form 20-F [19]; FY2024 Form 20-F [20]; FY2025 Form 20-F [21]; Q1 FY2026 earnings call [22].
The 109% recorded for 2025 is the lowest of the six years the company has disclosed, and the 108% reported for the first quarter of 2026 is lower still [23] [24]. The previous trough, 111% in 2023, was followed by a recovery to 127% [25], so a single weak reading in this series has not previously been the start of a trend.
Four qualifications belong with the number, and each of them cuts in a different direction.
The metric has been renamed twice. It was the "Dollar-Based Net Retention Rate" through FY2021 [26], the "Net Retention Rate" from FY2022 to FY2023 [27] and the "Customer Net Retention Rate" from FY2024 onward. The company states at each rename that the calculation is unchanged, and the overlapping years in successive filings carry identical values — 125% for 2021, 119% for 2022, 111% for 2023 — which is the strongest available confirmation that the series is continuous [28] [29].
The cohort it is measured on is shrinking as a share of the business. The top 200 clients were approximately 76.4% of revenue at the end of 2022, 77.6% at the end of 2023, 83% at the end of 2024 and approximately 79% in 2025 [30] [31] [32]. Growth outside the measured cohort is real revenue that the metric is built to exclude, so a falling cohort share and a falling retention rate are not two independent pieces of bad news — they can be two views of the same shift toward newer and smaller accounts.
Both recent readings are stated on a basis that removes the year's largest content addition. The 109% "excludes any contribution from IMG," and management says the 108% likewise excludes existing customers' use of IMG content while including the currency headwind [33] [34]. The company does not publish an including-IMG figure, so the size of that adjustment cannot be checked from outside — and the same quarter's Betting and Gaming Content line grew 20% on "strong demand for IMG content across our client base" [35] [36]. On the disclosed basis, in other words, the cross-sell that most visibly worked in the period is the one the retention metric leaves out.
And the decline cannot be attributed. Sportradar has not disclosed a customer count since FY2022, when it reported 1,790 customers [37], and no filing or transcript in the corpus names an account won from or lost to a competitor in any period. Whether 109% reflects pricing, contraction inside accounts, or outright attrition is not determinable from the record.
The nearest peer number is not a like-for-like substitute. Genius Sports states that net revenue retention "remains in the 120% to 130% range across our Sportsbook customers year after year" across "circa 500 licensed Sportsbook brands" [38]. That is a single-product cohort of a different size, measured on a different definition, disclosed on a call rather than in a filing. It establishes that a rival claims a higher expansion rate; it does not measure the difference.
The bill compounding faster than the book
The barrier and the largest claim on future cash are the same line item, and both are visible in the same filing.
Sport rights expense — non-capitalized rights plus the amortization of capitalized licences — was €214.2 million in FY2023, €352.4 million in FY2024 and €404.3 million in FY2025 [39]. Against revenue that is 24.4%, 31.9% and 31.3%. The re-basing happened in FY2024 and has not reversed; management attributes the further FY2025 increase to the ATP partnership, the renewed MLB agreement and the addition of IMG ARENA rights [40].
The forward version of the same picture is the comparison between what Sportradar owes rightsholders and what customers have contracted to pay it. Both are disclosed, in different notes, on the same balance-sheet date.
Sources: licence fee payables from FY2025 Note 22 [41] and FY2023 Note on trade payables [42]; unsatisfied performance obligations from FY2025 Note 24 [43], FY2024 [44] and FY2023 [45].
Licence fee payables rose 42% during FY2025, from €1,074.0 million to €1,529.2 million [46]. Contracted unsatisfied performance obligations — the revenue customers have committed to and Sportradar has not yet delivered — rose 14%, from €1,854.6 million to €2,122.6 million [47] [48]. Three times the rate, on the face of it.
That single-year ratio does not survive contact with the acquisition, and the honest version is more interesting than the headline. IMG ARENA arrived with €122.4 million of current and €350.1 million of non-current trade payables — €472.5 million in total, assumed rather than incurred [49]. Sportradar's non-current trade payables consist entirely of licence fee payables for capitalized sport rights [50], so at least €350.1 million and at most €472.5 million of the €455.2 million increase came in through the acquisition rather than from new rights bought with the company's own signature. Removing that band leaves an ex-acquisition payables balance between €1,056.7 million and €1,179.1 million — somewhere between 2% lower and 10% higher than the year before. The company discloses no roll-forward of the payable, so the split cannot be closed further than that band. The backlog is contaminated the same way: IMG's customer contracts sit inside the €2,122.6 million and are not broken out.
The multi-year view is the one that survives the acquisition, and it says the same thing more slowly. Between the end of 2022 and the end of 2025, licence fee payables went from €413.2 million to €1,529.2 million, a factor of 3.7 [51] [52]. Contracted customer backlog went from €943.9 million to €2,122.6 million, a factor of 2.2 [53] [54]. Expressed as a coverage ratio, what the company owes rightsholders was 44% of what customers had contracted to pay it at the end of 2022 and 72% at the end of 2025. The obligations compounded at roughly 55% a year over that span against roughly 31% for the contracted book — not three times, but consistently and over three years, and through a period in which one full rights cycle was renewed.
The renewal clock
The exclusivity is concentrated, and it runs off on a schedule the company publishes. Six individual sport rights licences each exceed roughly 5% of the licence balance; together they carry a net book value of €1,020 million and constitute 70% of the total [55].
Source: FY2025 Form 20-F, Note 13 Intangible assets and goodwill [56].
The weighted-average remaining life of those six is 5.6 years. The rest of the licence portfolio averages 3.7 years [57]. The whole exclusivity position, in other words, comes up for renegotiation inside the decade, and the smaller thirty percent of it comes up first. The price of the next round is set by the counterparties, not by the buyer — and the last full round is the one that took rights expense from 24.4% of revenue to 31.9%.
Some of those counterparties are also shareholders. The eight-year NBA agreement grants warrants exercisable, once vested, for Class A ordinary shares equal to 3.00% of the total outstanding on a fully diluted, as-converted basis at an exercise price of $0.01 [58]. The eight-year MLB agreement signed in February 2025 issues MLB equity with a cash value of $35.5 million, up to 1,855,724 Class A shares vesting to July 2032 [59]. Part of the rights bill is settled in ownership, which means the leagues that set the largest cost line hold a claim on the equity that line is levered against.
What can be repriced, and by whom
Against the compounding claim sits genuine contractual visibility. Of the €2,122.6 million of contracted backlog, €1,357.0 million is scheduled for recognition in 2026 [60]. FY2026 revenue guidance is €1,557–1,582 million [61]. Roughly 86% of the guided year was already under contract at the point the guidance was set. That is the switching-cost claim showing up in a number rather than in an adjective.
The repricing surface is correspondingly narrow in any one year. The CFO puts the shape of it plainly: "about 2/3 of our revenue are fixed fee, 1/3 are variable[;] out of the 2/3 that are fixed[,] traditionally, about 1/3 comes up every single year" [62]. That is roughly 22% of the book renegotiated annually, spread through the year rather than at a single renewal date. The counterparty side of that negotiation is fragmented, on the client concentration figures established in Rights and Data Layer.
What the record does not contain is a price-versus-volume bridge. Sportradar has published no decomposition of revenue growth into price and volume in any period covered here. The clearest evidence that data prices are moving comes from outside the company, from a firm that is simultaneously a Sportradar customer and a competitor: Kambi guided its 2026 cost of sales higher on "an increase in recharged data supplier and other supplier costs, which are charged through to customers," alongside "the impact on commission rates of certain key partner renewals" [63]. Data-supplier costs in this layer are rising and are being passed down the chain rather than absorbed. That is third-party corroboration of direction, from a party with no incentive to flatter its supplier, and it stops short of quantifying what any one supplier captured.
Where the contest is actually being fought
The competitive language in the peer shelf is not about headline price. It is about the cost and the speed of turning a live event into a priced market — and both principal peers position against the human-operator model rather than under it.
Genius Sports: "Legacy manual data capture, where humans key in events from television feeds is obsolete. Leagues are transitioning towards automated AI-driven solutions, and we are winning that transition." It expects that automation to span its entire data rights portfolio "by the end of next year" and describes "a meaningful opportunity to take market share and drive incremental revenue with limited additional costs" [64].
Kambi has taken the same argument into the odds layer, which is Sportradar's. It reports that 49% of all bets across its network were fully AI-traded in 2025 and that it passed 50% in January 2026 [65]. Its Odds Feed+ pricing service — sold, in its CEO's words, against "established incumbents in the odds feed space" — added FDJ UNITED, Hard Rock Digital, LeoVegas, Superbet and Rei do Pitaco during 2025, reaching seven odds-feed partners at year end [66] [67]. After the 2026 World Cup its CEO put the operating-leverage claim directly: "others still reliant on manual trading will need to scale back down now… We will not have this need to scale anything down" [68].
The scale of that particular threat should be kept in proportion. Kambi's Turnkey Sportsbook still generated 87% of its total revenue in 2025 [69]; seven odds-feed partners is a beachhead, not a share shift. And Kambi's own European commentary describes a mature market where the emphasis falls "on winning business from competitor suppliers" [70] — which is the condition under which a beachhead matters more than its current size.
Sportradar identified this contest before either rival made it a slogan. The FY2021 Form 20-F states the risk in its own words: if a competitor "replaces the need for data journalists before we do, our business could be materially harmed" [71]. The FY2025 filing shows the company building toward that objective: automated collection and production of live events using computer vision, and a proprietary transformer-based foundation model of basketball trained on tracking data and 3D body-pose sequences [72].
The human cost line has nonetheless grown faster than revenue. Data journalist and freelancer fees were €24.1 million in FY2023, €22.4 million in FY2024 and €31.7 million in FY2025 — up 42% in a year when revenue rose 16.6% [73].
Source: FY2025 Form 20-F, Note 6 Purchased services [74].
There are two readings of that line and the filing supports the benign one. Management attributes the rise in purchased services partly to "additional scout costs driven by the expansion of product offerings and data collection" [75] — more events covered requires more people at more venues, whatever the automation rate on the events already covered. The line is not a per-event unit cost and cannot be read as one. But it is the only human-capture cost the company discloses, and in the year two rivals declared the manual model finished, it grew two and a half times as fast as revenue. The metric that would settle it — cost per collected event, or the share of events captured without a human present — is not disclosed by any party in this record.
What the exclusivity has established, and what it has not
The company's self-description has moved once, and in one direction. The IPO-year filing headed the section "The only end-to-end data and software solutions provider with a global footprint" and stated: "We are the only company providing software solutions that address the entire sports betting value chain" [76]. From FY2022 onward the identical passage reads "a leading provider" [77], and it still reads that way in FY2025 [78].
Set against the evidence assembled here, the two halves of the barrier claim stand on very different ground.
The input side is established in numbers. Assembling an exclusive rights book at this scale costs €404.3 million a year in expense and €1.5 billion in accumulated obligations, and the clearest external mark on what that costs a sub-scale operator is that a rival's entire rights portfolio changed hands with money moving toward the buyer — the transaction and the market structure it produced belong to Rights and Data Layer, and the obligations that travelled with it to Rights Bought on Credit. Contracted backlog covering 86% of the guided year [79], and a client base with no account above 10% [80], are integration and diversification showing up as arithmetic rather than adjectives.
The output side is not established. The measure of pricing and expansion power the company chose to publish is at its lowest reading in six disclosed years and lower again in the following quarter; the cohort it is measured on has shrunk; the record contains no price-versus-volume bridge, no customer count since 2022, no named account won or lost in five annual reports and every transcript, and no market-share estimate for any participant anywhere in the corpus. Delivered FY2025 growth ran below both the closest rival's and the end-market rate that rival cites. On this evidence the moat is narrow rather than wide, and it is asymmetric: demonstrated on the cost of assembling the input, not demonstrated on the ability to charge for the output.
Two things would change that read, and both are checkable on a date. A recovery in Customer Net Retention Rate through 2026 on an including-IMG basis — or the disclosure of that basis at all — would show the expansion engine restarting rather than the metric excluding the thing that worked. And the next rights round, whose first renewals fall due against a portfolio averaging 3.7 years outside the big six, will price what two decades of network and archive are actually worth to the counterparties who set the bill.
The rights book is the asset and the liability schedule, and FY2025 is the first year the record lets a reader watch both move at once. What it does not yet let anyone judge is whether the people running the company have been telling investors what to expect from it.
Guidance and Control
Sportradar has been a public company for five completed fiscal years, and in that time it has issued a full-year revenue range every March, revised it most Novembers, and reported against it every March after that. That sequence is a public ledger. It can be walked line by line, and the outcome of each entry is a matter of record rather than of interpretation.
The ledger is mostly good. It also contains one entry where the standard itself moved, and one where the disclosure that proved a promise was retired the year after the promise was met. Both changes were properly disclosed and neither is unusual on its own. What follows sets out the whole record — the floors raised and beaten, the single guide broken, the bar lowered, the segment line retired, the cash commitment kept — and then establishes who issues the word in the first place, on what mandate, and for how much longer that mandate runs.
Completed Years Public
Revenue Guides Cut
Founder Voting Power
Founder Economics
Sources: guidance record compiled from the nineteen earnings-call transcripts, Q3 2021 to Q1 2026 [1]; voting power from the FY2025 Form 20-F beneficial-ownership table as of March 12, 2026 [2]; economic ownership derived from the same table on a converted basis.
Five years of guidance
The pattern is consistent enough to state plainly. In four of the five years the company set a number, raised it during the year, and finished above it. In one year it set a number, reaffirmed it in August, and cut it in November.
Sources: initial and revised guidance from the earnings-call transcripts — FY2021 [3], FY2022 [4] and its November revision [5], FY2023 [6] and its November cut [7], FY2024 [8] and its raise [9], FY2025 [10] and its raise [11]; delivered revenue and Adjusted EBITDA from the FY2025 Form 20-F [12] and the FY2023 Form 20-F [13].
Two features of the table are worth separating. The first is the construction of the guide. FY2022 and FY2023 were issued as two-sided ranges; those are the two years that produced the only narrowed Adjusted EBITDA band and the only revenue cut. From FY2024 the company switched to "at least" floors — at least 20% growth in revenue and Adjusted EBITDA, equating to €1.050 billion and €200 million [14] — and every floor since has been raised in-year and cleared. A floor is a weaker commitment than a range, and it has a correspondingly better hit rate.
The second is the shape of the one miss. On August 9, 2023, asked whether a €10 million currency headwind pushed the company toward the low end of its range, the CFO answered that "we're reaffirming that we believe we will land in the guidance ranges that we set at the beginning of the year" [15]. Eleven weeks later, on November 1, the range came down to €870–880 million, attributed to a stronger euro against the dollar and to third-quarter softness in Managed Trading Services caused by a run of bettor-favourable soccer results [16]. The cut carried little warning, and the second of its two causes — client gaming revenue moving against the company through revenue-share contracts — is the mechanism Rights Bought on Credit sets out.
Attached to that same call was a cost commitment: a global workforce reduction that "should result in an approximate 10% reduction of the company's 2023 labor costs run rate" [17]. Adjusted personnel expense was €257.5 million in FY2023, €282.8 million in FY2024 and €310.8 million in FY2025 [18]. Against revenue those are 29.3%, 25.6% and 24.1%. The promise was delivered as a ratio — five points of operating leverage over two years — and not as a reduction in the absolute bill, which is the reading the words themselves supported.
The long-term bar
Alongside the annual guide the company has carried a multi-year standard, and that standard was reset once.
On March 20, 2024, reporting FY2023 and guiding FY2024, the CFO put it this way: "we are well on track to deliver on the long-term financial targets we outlined at the time of our IPO, namely, revenue growth of at least 20% and adjusted EBITDA margins in the 25% to 30% range" [19]. Twelve months and twelve days later, the Investor Day deck of April 1, 2025 published a three-year outlook: at least 15% revenue CAGR from €1.1 billion in 2024 to about €1.7 billion in 2027, Adjusted EBITDA margin of 27% in 2027 against 20% in 2024, and free cash flow conversion of 60% [20].
Source: revenue growth as computed in this report's fact table from revenue as filed, FY2021–FY2025 [21]; the 20% bar as reasserted on the FY2023 results call [22] and the 15% bar from the Investor Day 2025 deck [23].
FY2025 delivered 16.6% revenue growth. That clears the newer bar by 1.6 points and misses the older one by 3.4. The reset was published twelve months before the first year that would have failed the standard it replaced.
The margin half of the change runs the other way, and it belongs in the same paragraph. Adjusted EBITDA margin has moved 18.2%, 17.2%, 19.0%, 20.1% and 23.0% across the five years [24][25]. The IPO-era framing of a 25–30% margin was never within reach on the trajectory that existed when it was reasserted; the 27% target for 2027 sits inside the old band and asks for four points of expansion in two years off a base that has just produced 2.9 points in one.
Sources: realized margins from the FY2023 Form 20-F for FY2021–FY2023 [26] and the FY2025 Form 20-F for FY2024–FY2025 [27]; the 2027 target from the Investor Day 2025 deck [28].
Two readings of the reset are available and the record does not settle between them. One is that the company recalibrated to a post-IPO reality it could actually hit, and paired the lower growth number with a higher committed margin — a trade of top line for profitability that the realized margin series supports. The other is that the standard moved to meet the performance rather than the reverse. What would decide it is the 2027 outcome itself: 27% delivered on roughly €1.7 billion validates the first reading, and a second reset validates the second.
Disclosure retired after the proof
The clearest kept promise in the archive is also the one that can no longer be checked the same way.
On August 17, 2022 — with the United States segment losing money and the shares well below the offer price — the CEO told investors: "we now expect to achieve profitability in the U.S. at least 12 months ahead of the original 2025 target date" [29]. The company delivered. United States segment Adjusted EBITDA went from minus €22.6 million in 2021 to minus €4.1 million in 2022 to positive €18.9 million in 2023, on segment revenue that more than doubled from €71.7 million to €165.5 million [30]. A 2025 target was met in 2023.
Source: FY2023 Form 20-F segment tables; no United States segment figures exist for 2024 or 2025 because segment reporting was collapsed to a single reportable segment effective January 1, 2024 with prior periods restated [31][32].
The blank years are the point. In October 2023 the company reorganized; the restructuring completed in January 2024; and in reassessing its segment identification under IFRS 8 it "concluded that discrete financial information was available to allocate resources solely on a consolidated basis," making it one operating and reportable segment effective January 1, 2024, with historic periods restated [33][34].
The accounting rationale is standard and the trigger — a chief operating decision maker who allocates on a consolidated basis — is the correct test. The consequence is nonetheless specific: the line item on which the US commitment was verified stopped being published in the first year after the commitment was met, and there is now no continuous segment series against which to test any geographic mix claim. Management still describes US performance verbally — the US grew 23% in FY2025 and is 25% of total revenue, per the FY2025 results call [35] — but a spoken growth rate and an audited segment profit are different classes of evidence. This is the second of two disclosure changes in three years: four geographic segments through FY2022, two product segments in FY2023, one segment from FY2024.
The cash promise
Against those two, one multi-year commitment has been made and kept without amendment.
On August 17, 2022 — the same call as the US-profitability statement, and at a point when free cash flow for the year would come in at €5.5 million — the CFO said: "we believe that our business model can achieve the 55% to 60% free cash flow conversion targets over the long term" [36]. In March 2023, walking analysts through a year in which the cash balance had fallen from €743 million to €244 million, the interim CFO added: "we will remain cash flow positive" [37].
Source: free cash flow as computed in this report's fact table on an operating-cash-flow-less-capex basis; the underlying reconciliation is in the FY2025 Form 20-F, which also reports the company's own free cash flow of €167.2 million after lease principal [38].
Free cash flow has risen in every year since the promise, from €5.5 million to €174.7 million on the operating-cash-flow-less-capex basis charted above, and margin from 0.8% to 13.5%; on the company's own definition, which deducts lease principal as well, FY2025 free cash flow is €167.2 million. The two are the same year on two bases, not two readings of one. On the company's own definition and denominator, FY2025 conversion was 56% against 53% in 2024 and 30% in 2023 [39], and the first quarter of 2026 converted at 67% on €44 million of free cash flow [40]. The 55–60% band stated at the low point has been reached.
The counter-fact belongs in the same breath, and it is established rather than asserted: Rights Bought on Credit shows what carries that conversion — rights amortization that is non-cash in the year it is charged, rights principal that settles inside investing rather than operating, and a growing share of rights acquired without cash at all. The commitment was made about a ratio, and the ratio was delivered. Whether the ratio measures the same thing it did in 2022 is a separate question, answered there.
What the IPO cash did
The prospectus of September 14, 2021 priced 19,000,000 Class A shares at $27.00 and disclosed net proceeds to the company from the offering and concurrent private placements of approximately $634.6 million, intended "for working capital, to fund incremental growth and future acquisition of, or investment in, companies, technologies, products or assets that complement our business and other general corporate purposes," with the explicit caveat that the board would have broad discretion and no definitive plans existed [41].
What the cash actually did was retire debt. On July 14 and December 14, 2022 the company prepaid €200.0 million and €220.0 million of Facility B, "thereby reducing the outstanding Facility B commitments to zero," writing off €6.8 million of unamortized issuance costs in the process [42]. That is a defensible use of proceeds in a rising-rate year and it is the reason the borrowings line has been empty ever since — a fact whose significance Rights Bought on Credit develops.
The one discretionary venture investment made from that cash went the other way. On August 4, 2022 Sportradar bought 100% of Bettech Gaming (PYTY) Ltd from Carsten Koerl and minority shareholders for €7.0 million, and immediately contributed those shares plus €13.7 million of cash and a €14.3 million equalization payment to Ringier for a 49% interest in a new Swiss holding company, SportTech AG. The same disclosure notes that "Sportradar's director Marc Walder also serves as a director for Ringier" [43]. On May 31, 2023 — ten months later — the 49% was sold back to Ringier, producing a €13.6 million loss on disposal [44], on top of €4.0 million and €3.7 million of share-of-loss in 2022 and 2023.
The sums are small against a company now turning over €1.3 billion. The structure is what makes the episode worth recording: an asset sourced from the chief executive, contributed to a joint venture with a company whose chief executive sat on Sportradar's board, and unwound at a loss inside a year. It is the only transaction of its kind in the record, and the related-party disclosure around it was complete and contemporaneous.
Votes, economics and a dated sunset
Every commitment above was made by an executive team that serves at the pleasure of one shareholder.
Carsten Koerl holds all 783,607,701 outstanding Class B ordinary shares plus 1,840,883 Class A, giving him 78.7% of combined voting power as of March 12, 2026 [45]. The mechanism is nominal value rather than a separate voting right: Class B shares carry one vote each at one-tenth the nominal value of Class A, so the same capital buys ten times the votes, and each ten Class B convert into one Class A [46].
The gap that produces is visible in the same table. Canada Pension Plan Investment Board owns 31.8% of the Class A and casts 6.8% of the votes; Technology Crossover Management owns 13.6% and casts 2.9% [47]. Reinforcing it, the Articles strip voting rights from any newly acquired Class A stake above 10% of registered share capital, while grandfathering holders who were already above that line before the Articles were registered [48]. A rival bloc cannot assemble votes by buying stock.
The dual-class structure is not permanent. Each ten Class B shares convert automatically into one Class A upon the earliest of four events: the founder's death; his dismissal as chief executive for good cause under article 340c para. 2 of the Swiss Code of Obligations; September 30, 2028; or the Class B holder ceasing to hold shares representing 15% or more of aggregate nominal share capital.
Source: FY2025 Form 20-F, dual-class risk factor [49].
The date trigger requires no event and no decision. On the current share count, when it passes, the founder's voting power falls from 78.7% to roughly his economic stake — a little under 27%. Two years and two months separate this report from that conversion, and the fourth trigger runs in parallel: enough further selling of Class B, and the sunset arrives early.
The direction of the founder's stake
Across the two years leading into that clock, the direction of the founder's holdings has been one way.
Sources: beneficial-ownership tables as of March 1, 2024 [50], March 1, 2025 [51] and March 12, 2026 [52]; economic ownership derived from those tables on a fully converted Class A-equivalent basis.
Between the first and second rows the Class A holding fell by 3.50 million shares. Between the second and third it rose by 1.81 million — but only after a conversion in between: on April 16, 2025 Koerl converted 120,000,000 Class B into 12,000,000 Class A, with the Class B remaining in treasury pending cancellation [53]. Net of that conversion, roughly 13.7 million Class A shares were disposed of across the two years, and economic ownership on a converted basis fell from about 31.5% to about 26.8% while voting power fell 2.9 points.
Eight days after the conversion, on April 24, 2025, a secondary offering of 23 million Class A shares priced at $22.50. The selling shareholders included a CPPIB affiliate, TCV and Koerl; Sportradar concurrently repurchased 3 million shares, up to $75 million, under its own buyback authorization [54].
None of this was visible in real time. As a foreign private issuer, Sportradar's directors and officers were not required to file insider reports under Section 16(a) of the Exchange Act until March 18, 2026; principal shareholders remain exempt from Section 16(a) altogether, and officers, directors and principal shareholders all remain exempt from the Section 16(b) short-swing profit rules [55]. The sales are reconstructible from annual beneficial-ownership tables filed a year in arrears, and from a secondary offering prospectus. They were not reportable as they happened.
Then, on the April 28, 2026 first-quarter call — with the shares far below both the $22.50 secondary print and the $27.00 offer price — the founder said: "I believe the company's current valuation does not reflect the strength of our business and our long-term prospects, and I'm confident in the path we are on. Accordingly, I intend to personally purchase $10 million worth of shares in Sportradar when our trading window opens" [56].
Stated intent and realized cash flow point in opposite directions across the same two-year window, and $10 million is about 3% of the roughly $308 million those 13.7 million shares would have been worth at the $22.50 secondary price. Whether the purchase was executed is not answerable from this corpus: no post-May-2026 insider filing, 6-K or news item covering the period after the trading window opened appears in the record. It is, however, now a reportable event — the Section 16(a) obligation began on March 18, 2026, six weeks before the pledge — so it is dated and checkable in a way that the preceding two years of selling was not.
Who sits beneath, and what they are paid for
The layer under the founder is new. As of December 31, 2023, Executive Management comprised Ger Griffin as chief financial officer, Eduard Blonk as chief commercial officer, Ulrich Harmuth as chief strategy officer and Lynn McCreary as chief legal officer [57]. As of March 1, 2026 the executive officers are Koerl, Craig Felenstein as CFO since June 2024, and Michael Miller as chief administrative and legal officer [58]. A chief operating officer, Sameer Deen, was announced alongside the first-quarter results and started on May 18, 2026 [59]. The finance seat has turned three times since 2020: Alexander Gersh from July 2020 [60], whose departure Koerl announced on the same August 2022 call as the US-profitability commitment [61], then Griffin, then Felenstein. Institutional memory below the founder is under two years old.
What that layer is paid for is set out precisely. Long-term incentives run entirely on total shareholder return relative to the constituents of the Standard and Poor's 500 Information Technology index over two-, three- and four-year periods, on a curve that pays nothing below the 40th percentile, 50% at the 40th, 100% at the 60th, 150% at the 80th and 200% at the 95th or higher. Performance stock units were 70% of long-term grant-date value for executives other than the CEO in March 2025 and 100% for the CEO, who did not participate in the plan's first year [62].
That index contains no sports-data company, no betting supplier and no sports-rights holder. Payout therefore turns on how Sportradar's share price behaves against US mega-cap software and semiconductors, not on how it performs against Genius Sports or Kambi — the rivals The Barrier and the Bill benchmarks the operating record against. The 2025 tranches were struck at a weighted-average grant-date fair value of $26.35, against $12.59 for the 2024 grants and $11.40 for 2023 [63]. The shares closed at $14.68 on July 27, 2026, the last session in this report's price record, so the highest-struck tranche is also the one furthest from its threshold.
The annual bonus runs on company-wide Adjusted EBITDA, revenue and cash flow [64]. Adjusted EBITDA as the company defines it excludes share-based compensation of €56.1 million, non-routine litigation costs of €35.2 million, transaction-related costs of €11.6 million and the €2.2 million cost of the secondary offering in which insiders sold — all in FY2025 alone [65]. The composition of that gap and its recurrence are analysed in Rights Bought on Credit; the point here is narrower. Several of the excluded categories are costs management itself elects to incur, and the metric that determines the cash bonus is measured after they are removed.
Total FY2025 compensation for current directors and executive officers was CHF 13.6 million [66], of which the CEO's package was CHF 7.80 million — CHF 0.62 million of salary, CHF 0.61 million of bonus and CHF 6.31 million of stock awards, with no separate board fee [67]. Against a stake of roughly 80 million Class A-equivalent shares, the package is two orders of magnitude smaller than the holding; the incentive that matters is the direction of the stake, not the grant.
Five years of ineffective control
Every number in this report passes through a financial reporting system in which the company has reported a material weakness in every one of the five years it has been public.
Sources: FY2021 Form 20-F, material weakness identified as of December 31, 2021 [68] with no management report due to the SEC transition period [69]; FY2022 not remediated [70]; FY2023 conclusion [71] and adverse opinion [72]; FY2024 conclusion [73] and adverse opinion [74]; FY2025 conclusion [75] and adverse opinion [76].
The weakness was first identified in the run-up to the IPO and related to "insufficient design and implementation of controls, IT systems and segregation of duties" [77]. Five years later the FY2025 filing reports that despite "significant progress in our remediation efforts during the year," control over financial reporting "was not effective as of December 31, 2025," because the weakness "as reported in the prior year" has "not been fully remediated" [78]. It now reflects "insufficient design and implementation of control activities in certain financial reporting processes" plus "an insufficient complement of personnel with appropriate levels of knowledge, experience, and training" [79]. The processes affected are not named, so the exposure cannot be mapped to particular balances.
Three things about the table deserve to be read together rather than separately. KPMG AG has been the auditor since 2014 and has issued an unqualified opinion on the financial statements in every year, including the three in which it issued an adverse opinion on the control environment producing them [80][81]. Those two opinions are consistent — the statements can be fairly stated while the system that produced them is judged unreliable, because the company performed "additional analysis and procedures" to compensate [82]. Compensating procedures are, by construction, manual and after the fact.
And the same auditor flags two critical audit matters, both attaching to the largest items on the balance sheet. The first, present in both FY2024 and FY2025, is the capitalization assessment for newly acquired or modified sport rights licences and the identification of the fixed minimum and variable payments used to measure them, requiring "significant and complex auditor judgment." The second, new in FY2025, is the valuation of the €302.4 million of licence intangibles acquired with IMG ARENA, where "a high degree of subjective auditor judgement was required to evaluate the projected margins and discount rate" [83]. The asset the auditor names as hardest to audit is the same asset the company's entire capital deployment runs through, and it is the one whose measurement — described in Rights Bought on Credit — sets both the largest asset and the largest liability.
There is a plain reading in the company's favour: the remediation disclosure says a "significant number of deficiencies across several affected financial reporting process areas" were successfully addressed during 2025, and the direction of travel over five years has been toward fewer deficiencies, not more. There is no restatement in the record: the FY2025 cover page reports no correction of an error to previously issued financial statements and no error correction requiring a recovery analysis of incentive-based compensation [84]. The finding is duration, not error: nothing has yet gone visibly wrong, and the control environment has been formally inadequate for the entire life of the listing.
The record that is clean
Founder-controlled structures usually come with a related-party surface. This one does not.
The only recurring related-party item is €0.1 million of revenue in each of 2023, 2024 and 2025 with UAB TV Zaidimai, a Lithuanian company in which Koerl holds 33% [85]. Every related-party transaction must be reviewed and approved or ratified by the audit committee under a written policy, which requires an assessment of whether terms are comparable to arm's length [86]. No dividend has ever been declared since incorporation [87], which is consistent with a reinvestment-first policy rather than with extraction.
Nine of the ten directors are determined independent under Nasdaq rules, each elected individually and annually by the general meeting, with a non-executive chairman and Koerl as the only executive on the board [88]. That is a stronger formal structure than a controlled company is obliged to maintain.
Two qualifications sit alongside it, both from the filings themselves. First, all of those annual elections are decided by a holder with 78.7% of the votes, and the CEO's own compensation is reserved for the full board rather than for the compensation committee [89]. Second, two of the nine independent directors are employed by shareholders: John Doran is at TCV, which holds 13.6% of the Class A, and Pascal Keutgens at CPP Investments, which holds 31.8%. Both sit on the compensation committee that sets pay for executives other than the CEO [90], both take no compensation for board service [91], and the Shareholders' Agreement among Koerl, CPP and TCV provides director-nomination rights until a party falls below 7.5% of share capital [92]. Board composition is partly contractual rather than purely elective.
Authorized and executed
The last commitment on the ledger is capital return, where the authorization and the execution are two different numbers.
Sources: authorization steps and cumulative repurchases of $111.2 million through December 31, 2025, of which $90.9 million was executed during 2025, from FY2025 Form 20-F Note 19.3 — the December 2024 figure of roughly $20 million is the difference [93]; the October 2025 cumulative figure from the Q3 2025 call [94]; the February 2026 increase to $1 billion, the $171 million repurchased as of February 27, 2026 and cumulative repurchases of $228 million as of April 24, 2026 from the Q4 2025 and Q1 2026 results releases [95][96].
The authorization went from $200 million in March 2024 to $300 million in October 2025 to $1.0 billion in February 2026 — a fivefold increase in under two years [97][98]. Execution over the same period was 12.5 million shares for $228 million, an average of roughly $18.24, against the $27.00 offer price [99]. Management has been explicit throughout about why the two diverge: "our capital allocation priority is investing in expanding the long-term growth potential of the company, and we will weigh returning capital to shareholders versus additional organic and M&A investment opportunities," a formulation repeated near-verbatim on the Q3 2024 and Q3 2025 calls [100][101]. A large authorization with modest execution is what that stated hierarchy predicts.
The effect on the share base is the part worth stating precisely, because it runs against the usual intuition about buybacks.
Source: weighted-average diluted Class A and Class B share counts from FY2025 Form 20-F Note 12; the Class A-equivalent column adds Class B at its one-tenth dividend entitlement and is derived from the same table [102].
Three consecutive years of repurchases — €9.0 million, €28.7 million and €105.2 million of treasury purchases [103] — have coincided with a diluted Class A count rising from 226.6 million to 237.5 million, and a combined Class A-equivalent base rising from about 317.0 million to about 319.4 million [104]. Issuance has outrun retirement. In FY2025 alone, 3.1 million treasury shares were surrendered back into vesting equity awards [105], and €34.2 million of shares were granted to a sport rights licensor, following €52.0 million granted to a licensor in 2023 [106].
That licensor equity connects to a statement made on the first call the company ever held as a public company. On November 17, 2021, disclosing the NBA's stake alongside the eight-year data agreement, the CEO said: "As a very general statement, I think you will not see too many equity deals from Sportradar, like we did it now with the NBA," and later on the same call, "from the scope of Sportradar, you will see not many of those deals following now the scope of the NBA" [107][108]. Two further grants totalling €86.2 million have followed, in 2023 and 2025 [109]. Two is not many, and the statement was hedged; the direction is nonetheless the opposite of the one it pointed in, and it is the mechanism by which the rightsholders described in The Barrier and the Bill became shareholders as well as creditors.
April 2026 is the first genuine change of pace. On April 28 the company announced a $250 million enhanced open-market repurchase to be completed in roughly three months, having repurchased about $90 million in the first quarter [110][111]. One quarter's programme now exceeds the $228 million executed across the preceding twenty-five months. The share-count effect of it, and the market context in which it is running, belong to Priced for an Allegation.
Where the record stands
The five-year ledger reads as follows. Four annual revenue guides raised and beaten; one cut, eleven weeks after being reaffirmed. A US-profitability commitment met a year early and then made unverifiable in the same form when segment reporting collapsed to a single line. A cash-conversion band promised at the low point and reached. A long-term growth bar lowered by five points twelve months before the first year that would have failed the old one, paired with a committed 2027 margin of 27% that sits inside the old 25–30% band and seven points above the 2024 level. IPO proceeds that retired debt rather than funding the growth and acquisitions the prospectus named, and one venture bet sourced from the CEO and unwound at a €13.6 million loss inside ten months. A related-party record that is close to empty, a board that is formally independent and elected annually by one holder, and a control environment that has been judged ineffective in every year of the listing.
Four things on that ledger are open, dated and checkable.
Sources: the FY2026 outlook and its reaffirmation from the Q1 2026 deck [112] [113]; the Q2 2026 reporting date from the news archive [114]; the repurchase programme and the personal-purchase statement from the Q1 2026 call [115]; the Section 16(a) effective date from the FY2025 Form 20-F [116]; the conversion date from the dual-class risk factor [117].
The read this chapter lands on is that the record is mixed and legible rather than uniformly good or bad: the annual word has been kept far more often than not, while the two commitments that were most testable — the long-term growth bar and the US segment — are the two that can no longer be tested the way they were made, one having been reset and the other retired from disclosure. The strongest fact against that read is the cash-conversion promise, which was made at the worst possible moment, involved no restatement of the standard, and was delivered. What would move the read either way is the 2027 margin outcome against the 27% bar, and whether the FY2026 guide survives contact with the second half without amendment.
None of that is what has actually moved the share price. The FY2026 guide was reaffirmed six days after the shares fell from $16.84 to $13.04 in a single session [118], and that fall attached to neither a reported result nor a missed guide.
Priced for an Allegation
The full-year guide was reaffirmed on April 28, 2026 [1]. Six days before that, the shares closed at $13.04 against $16.84 the session before — a fall of 22.6% that followed no reported result, no withdrawn guide and no company disclosure of any kind [2]. Everything the market has done to this company since is dated from that session, and the arithmetic in the current price has to be read against it.
What follows is that arithmetic: what $14.68 pays for on the company's own presentation and on a stricter one, where consensus sits relative to a guide management has not moved, and which parts of the forward number the published record supports. It closes on the three things the record does not settle.
Share Price, July 27 2026
Drawdown from High
EV / FY2026E Adj. EBITDA
FY2026E FCF Yield
Sources: closing price and the drawdown from the highest close in the available record, from the daily price series [3]; the enterprise-value multiple and free-cash-flow yield are derived below from that price, the FY2025 share and treasury counts [4] [5] and consensus estimates.
One session, and the path since
On the morning of April 22, 2026 two short sellers published on Sportradar. Muddy Waters titled its report "Putting the BET into Aiding and Abetting" and estimated that 20% to 40% of revenue came from illegal operators, on the basis of a six-month investigation, a sting at the ICE 2026 trade show, source-code analysis of more than 40 betting platforms and fifteen employee interviews; Callisto Research published alongside it [6]. The shares fell 22.6% that day on 27,482,052 shares against a 90-session median of 2,431,523 — 11.3 times normal — and the tape has not returned to the pre-report level since [7].
The company puts the same exposure at "a low to mid-single-digit number of our total revenues," with a simulation on public data reaching "a maximum of 12%" [8]. Which figure is closer is a question about the size of the unregulated customer base, and the reasons it cannot be settled from outside the company are set out in Rights and Data Layer. What matters here is narrower and fully observable: the whole of the visible de-rating attaches to that publication rather than to any number the company has reported.
Source: daily closing prices as recorded in the run's price series, cross-checked row-for-row against an independent exchange history endpoint [9] [10].
Source: daily share volume from the same price series [11].
The path since separates into pieces worth naming.
The quarter did not stop the fall. Q1 results were pulled forward a week to April 28; on the day they were published the shares fell a further 11.3% to $12.35, the lowest close in the record [12]. From that low the price is up 18.9% to $14.68. Measured from the highest close available — $19.69 on March 19, 2026 — the peak-to-trough decline inside the window was 37.3%, and the drawdown at July 27 is 25.4%.
The largest upward move since has a name and a date. The shares closed at $13.90 on June 5 and $16.96 on June 11, a gain of 22.0%, across the June 4 announcement of a renewed Wimbledon data and audiovisual betting deal — a right inherited in the IMG ARENA acquisition — and the June 8 Kalshi prediction-markets partnership [13] [14]. By July 27 the price had given back 13.4% of that, to $14.68. Roughly two-thirds of the move those two announcements produced is no longer in the price.
Three checks a reader would expect at this point cannot be run on this record, and each absence is worth naming. There is no base rate for earnings-day reactions: one earnings date sits inside the 90-session price history, April 28, so no distribution of surprise against realised move can be built, and the single observation available is an 11.3% decline on a quarter that missed. Positioning cannot be sized: the run's short-interest file reports no official position rows, no short-sale volume, no borrow-pressure indicators and no days-to-cover, so how crowded the short side became after April 22 is unknown. And every derived technical series in the run — volatility, relative performance, moving averages, unusual-volume detection — returns unavailable on a 90-session history. Two of the largest single sessions in the window, minus 8.4% on April 9 and plus 7.4% on July 6, have no dated cause anywhere in the corpus [15].
Sources: moves and volumes computed from the daily price series [16]; attributions from the dated news record [17] and the Q1 2026 results release [18].
What $14.68 buys
The share count has to be built before any multiple can be quoted, because two classes of share carry different economics. At December 31, 2025 there were 221,390,294 Class A shares issued and 903,670,701 Class B, of which 120,000,000 Class B — converted by the founder into 12,000,000 Class A in April 2025 — sit in treasury pending cancellation [19]. Class B carries one tenth of the nominal value and therefore one tenth of the dividend entitlement of a Class A share [20], so the 783,670,701 Class B shares outstanding are 78.4 million Class A-equivalents. Treasury holdings of 3,939,842 Class A come out [21]. That gives about 295.8 million Class A-equivalent shares at year-end. A further 6.6 million Class A were repurchased between January 1 and April 24, 2026 — the difference between 12.5 million shares for $228 million since the plan began and 5.9 million for $111.2 million through December 31 [22] [23] — leaving roughly 289.2 million.
At $14.68 that is a market capitalization of about $4.25 billion. Converting is the one place this arithmetic rests on an assumption rather than a document: no exchange rate is staged anywhere in this run, and the rate used here — 1.1375 dollars per euro — is implied by the run's estimates record, which carries the same 22-target analyst panel in both currencies — $14.91, $19.61 and $34.91 against €13.11, €17.24 and €30.69 [24]. On that rate the share price is €12.91 and market capitalization about €3.73 billion. Net cash at the FY2025 balance sheet date was €313.5 million, so enterprise value is roughly €3.42 billion.
Sources: derived from the July 27, 2026 close [25], the FY2025 share and treasury counts [26] [27], 2026 repurchases [28], reported FY2025 revenue and Adjusted EBITDA [29], the licence fee payable balance [30], and consensus Adjusted EBITDA from the run's broker estimate feed, for which no filing page exists.
On earnings the same price is 41.6 times FY2025 diluted Class A earnings of €0.31 [31], 29.8 times the FY2026 consensus of €0.43 and 18.7 times the FY2027 consensus of €0.69 [32]. On cash it is a 4.7% free-cash-flow yield on FY2025 free cash flow of €174.7 million, about 6.1% on the FY2026 consensus of €227 million and 8.0% on the FY2027 consensus of €297 million.
The same company, two enterprise values
The right-hand column of that table is not a stress test. It is the same multiple computed on the assumption that an interest-bearing obligation is debt.
Sportradar's quarterly releases state that it has no debt outstanding, and on the balance-sheet definition of borrowings that is accurate [33]. Sitting inside trade and other payables, however, are licence fee payables for capitalized sport rights of €319.4 million current and €1,209.9 million non-current — €1,529.2 million in total [34]. Rights Bought on Credit establishes what that balance is: interest-bearing, dollar-denominated vendor credit accruing roughly €80 million a year. Adding it to enterprise value moves the FY2026 consensus multiple from 8.8 times to 12.7 times, and the FY2027 multiple from 7.1 to 10.3.
The choice between 8.8 times and 12.7 times FY2026 consensus Adjusted EBITDA is not a judgment about the business. It is a decision about whether €1,529.2 million of interest-bearing licence fee payables belongs in enterprise value. Adjusted EBITDA is struck before finance costs either way, so the consistent treatment of an interest-bearing balance is to include it.
Two facts bound the question from the other side. The obligation is contractual rather than callable — it is the payment schedule on rights already licensed, disclosed with its maturity profile. And Adjusted EBITDA as the company defines it already carries the full cost of those rights, including amortization of the capitalized licences [35], so the earnings denominator is not flattered by the capitalization in the way it would be if that amortization were added back. The multiple is genuinely two-sided; what decides it is whether a fixed multi-year cash claim reads as financing or as working capital.
Two arm's-length marks
The company has been priced twice in transactions rather than on screens, and both marks sit above the current price.
The September 2021 initial public offering sold 19,000,000 Class A shares at $27.00 [36]. On April 24, 2025 a secondary offering of 23 million Class A shares was priced at $22.50, with a CPP Investments affiliate, TCV and the founder among the sellers while the company concurrently bought 3 million shares [37]. At $14.68 the shares sit 45.6% below the listing price and 34.8% below the secondary print.
Over the same span revenue went from €561.2 million in FY2021 to €1,290.0 million in FY2025 — 2.3 times — and free cash flow margin from 0.3% to 13.5%. The shareholder outcome since listing has been set by the multiple, not by the operating record.
One limit on that comparison belongs in plain sight. No price history before March 18, 2026 exists anywhere in this run, so the company's own historical multiple range cannot be computed and the two transaction prints are the only dated valuation anchors available. The drawdown figure of 25.4% is labelled in the run's fact table as a three-year drawdown but is computed over a 90-session history whose highest close is $19.69 on March 19, 2026; against the secondary print the trailing decline is at least 34.8%, and against the IPO price 45.6% [38].
Consensus has settled on the floor
Guidance for FY2026 was issued on March 3, 2026 and reaffirmed on April 28: revenue growth of 23% to 25% in constant currency, equal to €1,557 to €1,582 million as reported; Adjusted EBITDA growth of 34% to 37% in constant currency, equal to €390 to €400 million; margin of 25.0% to 25.3%, an expansion of 200 to 225 basis points; and free cash flow conversion above 56% [39] [40].
Consensus FY2026 revenue is €1,556.2 million [41] — €0.8 million below the floor of that range. The 21-analyst distribution runs from €1.52 billion to €1.56 billion, so the most optimistic published estimate also sits at the floor rather than inside the range. Consensus Adjusted EBITDA of €390.7 million is likewise the bottom of the guided band, though that panel is less uniform: its low of €362.6 million is €27 million below the guided floor and its high of €400.2 million matches the top. The reported-currency growth this implies is 20.6%, against the 23% to 25% constant-currency guide; the three-to-four point gap is dollar translation rather than demand.
What consensus embeds beyond FY2026 is a margin bend rather than sustained growth.
Sources: FY2025 actuals from the FY2025 Form 20-F [42]; FY2026 and FY2027 consensus revenue from the estimates record [43]; FY2028 and FY2029 revenue and all consensus Adjusted EBITDA from the run's broker estimate feed, for which no filing page exists.
Revenue growth steps down from 20.6% to about 10% by FY2029 while Adjusted EBITDA margin rises from 23.0% to roughly 31%, and Adjusted EBITDA and free cash flow grow faster than revenue in every visible year. Broker disagreement sits entirely below the revenue line. FY2028 revenue spans 7.5% of the mean across 13 analysts, while FY2027 statutory earnings per share span €0.45 to €0.93 — 73% of the mean — across 18, and FY2027 net income €141 million to €271 million across 15. Coverage also thins as the years extend: 21 analysts on FY2027 revenue, 13 on FY2028, two on FY2029, and three on the normalized earnings line in every annual period.
The drop-through the year requires
Because the argument is about what falls through to profit, the incremental margin — the share of each additional euro of revenue that reaches Adjusted EBITDA — is the number worth building from the primary record.
FY2025 delivered a good one. Revenue rose €183.4 million and Adjusted EBITDA €74.4 million [44], a drop-through of 40.5%. Against that, the FY2026 guide is not demanding in aggregate: €267 to €292 million of additional revenue producing €93 to €103 million of additional Adjusted EBITDA is 34.9% to 35.3% [45]. Consensus implies the same 35.3%.
The demanding part is that none of it has arrived. In the first quarter revenue rose €35.3 million to €346.5 million, up 11.3% as reported and 16% in constant currency [46] [47], while Adjusted EBITDA rose €7.1 million to €66.0 million — a drop-through of 20.0% [48]. Adjusted EBITDA margin was 19.0% against 18.9% a year earlier: ten basis points of expansion against 200 to 225 guided for the year [49] [50].
Subtracting the quarter from the year gives what the remaining nine months must do. Revenue must rise 23.7% to 26.2% as reported against 11.3% delivered; Adjusted EBITDA must rise 36.2% to 40.4%; the drop-through across those nine months must be 37.2% to 37.5% against 20.0% delivered; and margin over the balance of the year must run at 26.8% to 27.0% against 24.3% in the comparable period.
Source: derived from reported revenue and Adjusted EBITDA for FY2024 and FY2025 [51], Q1 2025 and Q1 2026 [52], and the reaffirmed FY2026 guidance range [53] [54]; the consensus figure is derived from the run's broker estimate feed.
Management's own framing is that the year is back-half weighted: the chief financial officer said on April 28 that the strongest revenue growth was expected in the second and third quarters given the timing of sporting events [55], and broker models carry the same profile, with a third-quarter Adjusted EBITDA margin near 31% against 19.6% in the first. That seasonality is real and disclosed. The observation that survives it is narrower: the aggregate FY2026 drop-through the guide asks for is lower than FY2025 delivered, and the one reported quarter of the guided year delivered half of it.
The revision tape
The estimate record has been turning down for four quarters, and the turn predates the short reports.
Source: consensus against reported revenue by quarter from the run's estimate feed, captured before each actual became effective; no filing page carries the consensus side. The Q1 2026 actual of €346.5 million is from the results release [56].
Revenue surprise decayed from plus 7.2% in the third quarter of 2024 to minus 4.2% in the first quarter of 2026 — €346.5 million against €361.7 million expected, the largest miss in the visible record and the third consecutive one. Normalized earnings per share for that quarter came in at minus €0.01 against €0.05 expected. The forward earnings line has been cut recently rather than gradually: FY2027 normalized earnings per share stood at €0.74 six months ago, €0.72 three months ago and €0.75 one month ago before dropping to €0.69, a 4.8% reduction over 90 days, while FY2027 revenue moved 1.3% over the same period. The line being cut carries three estimates; the revenue line it is derived from carries 21.
Twenty-two targets
The published sell-side distribution has not been rebuilt for a smaller revenue base.
Source: target-price distribution and recommendation mix as of July 23, 2026, from the analyst estimates record [57]; spot from the daily price series [58].
On the larger of the two panels in the record — 22 targets, updated July 23, 2026 — the mean is $21.15, the median $19.61, the high $34.91 and the low $14.91, which is 1.6% above the market price. The recommendation mix is 16 buy, two outperform, four hold, and no sell or underperform [59]. A second, partly overlapping panel of 19 analysts, last updated July 27, reads a mean of $22.47 with a high of $40.00 and a low of $14.00 — 4.6% below spot — and does carry two sell ratings [60].
Exactly one published target across the two panels sits below the market price, and no consensus or broker-model line anywhere in this run is built on a revenue base reduced for the April allegation. The gap between spot and the lowest target is the part of that allegation the published sell-side has not written down.
The bid inside the price
A mechanical buyer of size is operating in the tape being measured, and its scale relative to the market is unusual.
The authorization-versus-execution record is set out in Guidance and Control; what matters here is its size relative to the market. Authorization stands at $1.0 billion [61], which against a market capitalization of about $4.25 billion is 23.6%. Cumulative execution through April 24, 2026 was 12.5 million shares for $228 million [62], an average of about $18.24 a share and 24% above the July 27 close.
The pace then changed. On April 28 the board approved a $250 million enhanced open-market programme to be completed "within approximately 3 months, subject to trading volumes" [63]. At $14.68 that is about 17 million shares, or 5.9% of the Class A-equivalent base, inside one quarter. Against a median daily traded value of roughly $36 million, $250 million spread over about 63 sessions is on the order of 11% of the value changing hands. A programme of that relative size is part of the price being measured, and its completion window closes around late July 2026 — so the observed price includes it and the period immediately after does not.
On the same call the founder and chief executive announced an intended personal purchase of $10 million of shares [64]. Whether that purchase happened cannot be determined from this corpus; the reporting obligation that would make it visible took effect on March 18, 2026 [65], and the ownership record behind the pledge is set out in Guidance and Control.
Management's reaction to the drawdown was, in short, an unchanged guide plus buying. The chief executive opened the April 28 call by rejecting the reports directly — "Sportradar and I reject the unfounded and misinformed allegations contained in the reports" — and referred investors to a compliance filing made the same morning [66].
The back-half driver, read three ways
Asked on April 28 what supported an unchanged guide after a quarter that grew 11%, the chief financial officer named three things — marketing services normalising, further IMG synergies, and one more: "the third and probably the biggest is we have really good sight lines right now, we think, with regards to some prediction market revenue opportunity that's going to happen in the predominant in the back half of the year" [67].
Prediction markets are regulated in the United States as derivatives venues, where participants trade event contracts on outcomes rather than placing wagers with a bookmaker. The interest for a data supplier is that those venues need the same official feeds, prices and integrity monitoring an online sportsbook needs.
Eight weeks earlier the same executive had sized that line differently. On March 3, asked directly whether prediction-market revenue was in the 2026 guide, he answered: "We do have some minor contributions from prediction markets in our 2026 guidance, predominantly from things like customer acquisition, fan engagement tools, and a little bit of data that we would be providing. For the most part, any significant deal associated with prediction markets is not included in that guidance" [68]. On the same call the chief executive put a magnitude on the whole opportunity: an uplift "in the tens of millions, not in the hundreds of millions, from prediction markets" [69].
So the same line moved from a minor contribution with significant deals excluded, to probably the biggest reason the year holds, in eight weeks — with nothing signed in between. On April 28 the stated position was that the company was "in an active commercial discussion with a number of prediction market players for the use of official data and products related to MLB, NHL, MLS and UFC amongst other global leagues and competitions" [70]. The signature came six weeks later, on June 8, when the Kalshi partnership was announced [71].
Whether that signature is upside to the guide or already inside it is unclear from the record, and the ambiguity is management's own. On the April call the chief financial officer said that "if anything that happens in, what I would say, short term gets announced, you can pretty much assume that, that was included in our estimates for the year. Anything that gets done a little bit later, you can assume is additive on top of that" [72]. Six weeks is not obviously either.
The magnitude the company itself has offered is the useful check. Tens of millions of euros against a guide of €1,557 to €1,582 million is one to three points of revenue, and the nine-month revenue increment the guide requires is €232 to €257 million. On the company's own sizing, prediction markets cover a meaningful minority of that gap rather than most of it — which puts the weight of the reaffirmation back on marketing services recovering and IMG content continuing to sell.
The company's own risk disclosure runs the other way from its guidance commentary, and both statements are the company's. The FY2025 annual report lists competitive, regulatory and contractual risks from prediction markets, including whether they "may reduce the size, scale, or growth of traditional sports betting markets, which could diminish the value of our existing data licensing arrangements and other commercial relationships in that space," and notes that disputes between state regulators, the venues and market participants have already produced litigation, state regulatory actions, proposed federal rulemaking and legislative action [73] [74].
Three other suppliers to the same industry have described the same development in their own filings and calls, and they do not agree.
Sources: Sportradar's Q1 2026 earnings call [75] and Q4 2025 earnings call [76]; Genius Sports' Q3 2025 earnings call [77]; Kambi's Q1 2026 earnings call [78]; Better Collective's 2025 annual report [79].
The disagreement is not cosmetic. Kambi, whose platform business sits one layer downstream, reports zero measurable effect on its own revenue and says several of the 60-plus regulators it deals with have told it that engaging with these venues is not an option [80]. Genius Sports, the closest comparable in the rights-and-data layer, describes the same development as a possible expansion of its addressable market but has set explicit regulatory and commercial thresholds before it will participate [81]. Sportradar has signed. That is a real difference in posture between two companies competing for the same rights and the same customers, and it is the kind of divergence that resolves into numbers within a few reporting periods rather than years.
Dated ahead
Four things in front of this price are dated and checkable, and each names a line a reader can test.
Sources: the August 3, 2026 results date and quarterly consensus from the estimates record [82]; the repurchase programme from the Q1 2026 results release [83]; the class-action filings and lead-plaintiff deadline from the dated news record [84]; the personal-purchase statement from the Q1 2026 earnings call [85]; FY2025 non-routine litigation costs from the FY2025 Form 20-F reconciliation [86].
Three questions the record does not answer close the account.
The first is the size of the contested revenue base. No document in this corpus quantifies revenue attributable to operators alleged to be unlicensed, and no estimate line in either the consensus or the broker-model feed is built on a reduced base. The price implies some probability that the base shrinks; the record holds no number against which to test that probability, from either direction.
The second is the composition of the back half. The largest named driver of the reaffirmed guide is a revenue line the company sized at tens of millions in March, called probably the biggest support for the year in April, and contracted with one venue in June — while its own annual report lists the same development as a competitive, regulatory and contractual risk, and two peer suppliers read it in opposite directions.
The third is what the price contained. Roughly $250 million of company buying was scheduled into about 63 sessions ending in late July 2026, in a stock whose median daily traded value is near $36 million. The August 3 print is the first observation of both the business and the tape without that programme running.
At $14.68 the shares carry a market capitalization of about $4.25 billion, an enterprise value of roughly €3.42 billion on the company's presentation or €4.95 billion counting the licence fee payable, 8.8 or 12.7 times FY2026 consensus Adjusted EBITDA, a 6.1% forward free-cash-flow yield, and a 45.6% discount to a listing price set on 43% of the current revenue. The de-rating is dated to one April session, and the guide it fell through has not moved since.
The numbers behind Sportradar Group AG: as-reported financial statements and company metrics for FY2021–FY2025, traced to the source filings, opened with the share-price history those statements have to justify. Every linked figure opens the exact page of the filing it was printed on, with the statement row highlighted. Amounts in € thousands unless noted.
Reading notes: Sportradar reports under IFRS in euros and files on Form 20-F as a foreign private issuer. All figures are in thousands of euros exactly as printed ('Expressed in thousands of Euros'). The Class A shares trade in US dollars on Nasdaq under SRAD. FY2023-FY2025 income-statement, cash-flow and revenue-note figures come from the FY2025 Form 20-F; FY2022 from the FY2024 Form 20-F (income statement) and the FY2023 Form 20-F (balance sheet, cash flow, EPS); FY2021 from the FY2023 Form 20-F (income statement, cash flow) and the FY2021 Form 20-F (balance sheet). FY2019-FY2020 long-term figures are comparative columns of the FY2021 Form 20-F. Expense presentation changed in the FY2024 Form 20-F: 'Purchased services and licenses' and a single 'Depreciation and amortization' line were re-presented as 'Sport rights expenses (including amortization of capitalized sport rights licenses)', 'Purchased services' and 'Depreciation and amortization (excluding amortization of capitalized sport rights licenses)'. FY2022-FY2025 are shown on the new basis; FY2021 was never re-presented, so those three rows are blank for FY2021. As originally printed in the FY2023 Form 20-F (p.132), FY2021 showed Purchased services and licenses of (119,426) and Depreciation and amortization of (129,375). The Betting Technology and Solutions / Sports Content, Technology and Services revenue grouping was introduced in the FY2024 Form 20-F and disclosed back to FY2022 only. FY2021 revenue was reported on the earlier Rest of the World Betting / Betting AV / United States basis (RoW Betting 309,357; Betting AV 140,162; United States 71,700; Other 39,983) and is left blank in the product-group table.
Share Price — Available History Since March 2026
The stock closed at $14.68 on Jul 27, 2026 — down 20% over the window shown, trading between $12.35 and $19.69.
Source: market price feed, daily closes, Mar 2026–Jul 2026 — the feed marks this available history as partial. Price return only, excludes dividends.
FY2025 at a Glance
Revenue (€ thousands)
Net income (€ thousands)
Diluted EPS
Source: FY2025 consolidated statements [1] [2] [3]. Click any linked figure to open the filing page with the row highlighted.
Revenue by Product Group
| Revenue by Product Group | FY2021 | FY2022 | FY2023 | FY2024 | FY2025 |
|---|---|---|---|---|---|
| Betting and Gaming Content | — | 444,280 | 530,099 | 707,119 | 817,295 |
| Managed Betting Services | — | 135,157 | 173,391 | 199,871 | 229,775 |
| Total Betting Technology and Solutions | — | 579,437 | 703,490 | 906,990 | 1,047,070 |
| Marketing and Media Services | — | 105,478 | 126,629 | 146,919 | 181,568 |
| Sports Performance | — | 37,412 | 39,758 | 40,366 | 43,692 |
| Integrity Services | — | 7,861 | 7,744 | 12,281 | 17,635 |
| Total Sports Content, Technologies and Services | — | 150,751 | 174,131 | 199,566 | 242,895 |
| Total Revenue | — | 730,188 | 877,621 | 1,106,556 | 1,289,965 |
| Total Revenue growth, derived | — | — | +20.2% | +26.1% | +16.6% |
Source: Note 4 Revenue from contracts with customers — major product groups (FY2025 Form 20-F p.143; FY2022 column from the FY2024 Form 20-F p.145). The Betting Technology and Solutions / Sports Content, Technology and Services grouping was first reported in the FY2024 Form 20-F and is not available for FY2021. [4] [5]. Click any linked figure to open the filing page with the row highlighted.
Income Statement
Source: Consolidated Statements of Profit or Loss and Other Comprehensive Income (IFRS). FY2023–FY2025 from the FY2025 Form 20-F p.125; FY2022 from the FY2024 Form 20-F p.125 (re-presented sport rights basis); FY2021 from the FY2023 Form 20-F p.132. [1] [2] [3]. Click any linked figure to open the filing page with the row highlighted.
Columns marked E are consensus analyst estimates from S&P Capital IQ (CapIQ), shown alongside reported results for direct comparison; they are not company guidance.
Estimate source: S&P Capital IQ (CapIQ) consensus, as of 2026-07-28. Estimate figures are S&P Capital IQ consensus (vendor data — no filing page links). EPS and net income use the normalized (adjusted) consensus where the street reports it. Line-item analyst models (segments, drivers, KPIs) are in the Visible Alpha tab.
Balance Sheet
Source: Consolidated Statements of Financial Position. FY2024–FY2025 from the FY2025 Form 20-F p.126; FY2022–FY2023 from the FY2023 Form 20-F p.133; FY2021 from the FY2021 Form 20-F p.144. [6] [7] [8]. Click any linked figure to open the filing page with the row highlighted.
Cash Flow
Source: Consolidated Statements of Cash Flows. FY2023–FY2025 from the FY2025 Form 20-F p.128; FY2021–FY2022 from the FY2023 Form 20-F p.135. [9] [10]. Click any linked figure to open the filing page with the row highlighted.
Revenue by Region
| Revenue by Region | FY2021 | FY2022 | FY2023 | FY2024 | FY2025 |
|---|---|---|---|---|---|
| Europe | — | — | 464,012 | 562,024 | 640,547 |
| North America | — | — | 195,883 | 301,269 | 366,210 |
| AsiaPac and Middle East | — | — | 108,412 | 116,466 | 134,430 |
| LATAM and Caribbean | — | — | 86,006 | 99,879 | 123,113 |
| Africa | — | — | 23,308 | 26,918 | 25,665 |
| Total | — | — | 877,621 | 1,106,556 | 1,289,965 |
Source: Note 5 Segmental information — Geographic information, FY2025 Form 20-F p.146. Revenue is attributed to the geographic billing location of customers. The FY2023 Form 20-F disclosed geography by country rather than by region, so FY2021–FY2022 are not comparable and are left blank. [11]. Click any linked figure to open the filing page with the row highlighted.
Client Franchise and Contracted Revenue
| Client Franchise and Contracted Revenue | FY2021 | FY2022 | FY2023 | FY2024 | FY2025 |
|---|---|---|---|---|---|
| Top 200 clients — share of total revenue | 80.0% | 76.4% | 77.6% | 83.0% | 79.0% |
| Contracted revenue not yet recognized (remaining performance obligations) | — | 943,942 | 1,701,938 | 1,854,565 | 2,122,582 |
| — of which recognizable within the next 12 months | — | 622,425 | 898,546 | 1,030,799 | 1,356,955 |
| Clients served (Sportradar base) | 1,715 | 1,790 | — | — | — |
| Net revenue churn, top 200 clients | 0.39% | 0.70% | — | — | — |
Source: company filings [12] [13] [14] [15]. Click any linked figure to open the filing page with the row highlighted.
Sport Rights Investment and Obligations
| Sport Rights Investment and Obligations | FY2021 | FY2022 | FY2023 | FY2024 | FY2025 |
|---|---|---|---|---|---|
| Additions to capitalized sport rights licenses | — | 93,346 | 1,023,457 | 96,627 | 353,779 |
| Capitalized sport rights licenses — carrying amount | — | 374,221 | 1,234,544 | 1,090,818 | 1,466,702 |
| Amortization of capitalized sport rights licenses | — | 140,200 | 160,018 | 233,945 | 270,162 |
| Non-capitalized sport rights expenses | — | 46,812 | 54,171 | 118,490 | 134,157 |
| License fee payables for capitalized sport rights licenses — current | — | — | 202,013 | 178,296 | 319,362 |
Source: company filings [16] [17] [18] [19]. Click any linked figure to open the filing page with the row highlighted.
Non-IFRS Operating Economics (as defined by the company)
| Non-IFRS Operating Economics (as defined by the company) | FY2021 | FY2022 | FY2023 | FY2024 | FY2025 |
|---|---|---|---|---|---|
| Free cash flow | — | (435) | 50,383 | 117,526 | 167,181 |
| Free cash flow conversion (% of Adjusted EBITDA) | — | — | 30% | 53% | 56% |
| Adjusted personnel expenses | — | 217,379 | 257,547 | 282,814 | 310,804 |
| Adjusted purchased services | — | 127,015 | 145,177 | 153,966 | 173,733 |
| Adjusted other operating expenses | — | 72,936 | 93,909 | 94,923 | 104,322 |
| Share-based compensation (Adjusted EBITDA add-back) | — | 28,637 | 39,712 | 37,775 | 56,148 |
| Capitalized personnel compensation | — | 15,560 | 19,703 | 24,775 | 25,781 |
Source: company filings [20] [21] [22] [23]. Click any linked figure to open the filing page with the row highlighted.
Workforce
| Workforce | FY2021 | FY2022 | FY2023 | FY2024 | FY2025 |
|---|---|---|---|---|---|
| Permanent employees | 2,959 | 3,977 | 4,383 | 4,582 | 4,882 |
| Contingent workers | 341 | 467 | 453 | 439 | 466 |
| Total full-time equivalents (FTEs) | 2,959 | 4,163 | 4,552 | 4,766 | 5,090 |
| North America FTEs | 480 | 566 | 572 | 450 | 443 |
Source: company filings [24] [25] [26] [27]. Click any linked figure to open the filing page with the row highlighted.
Long-Term Record
| Fiscal year | Total revenue | Profit for the year | Diluted earnings per Class A share | Net cash from operating activities | Acquisition of intangible assets | Total equity |
|---|---|---|---|---|---|---|
| FY2019 | 380,403 | 11,665 | 0.05 | 145,966 | (91,576) | 154,044 |
| FY2020 | 404,924 | 14,806 | 0.06 | 151,259 | (91,956) | 164,132 |
| FY2021 | 561,202 | 12,787 | 0.05 | 132,221 | (124,890) | 735,634 |
| FY2022 | 730,188 | 10,491 | 0.03 | 168,077 | (154,266) | 757,429 |
| FY2023 | 877,621 | 33,894 | 0.11 | 258,645 | (185,493) | 872,837 |
| FY2024 | 1,106,556 | 33,612 | 0.10 | 353,011 | (222,288) | 929,847 |
| FY2025 | 1,289,965 | 100,324 | 0.31 | 403,015 | (223,377) | 978,337 |
Source: consolidated statements across filings; older years from the standardized feed [9] [6] [1] [10]. Click any linked figure to open the filing page with the row highlighted.
Operating KPIs
| KPI | FY2021 | FY2022 | FY2023 | FY2024 | FY2025 |
|---|---|---|---|---|---|
| Adjusted EBITDA | 102,013 | 125,846 | 166,799 | 222,418 | 296,787 |
| Adjusted EBITDA margin | 18.2% | 17.2% | 19.0% | 20.1% | 23.0% |
| Customer Net Retention Rate | 125% | 119% | 111% | 127% | 109% |
Source: company-reported operating metrics [28] [29]. Click any linked figure to open the filing page with the row highlighted.
Analyst Consensus
Mean target
Median target
High target
Low target
Street ratings: 16 strong buy, 2 buy, 4 hold. Consensus: Strong Buy.
Estimate source: S&P Capital IQ (CapIQ) consensus, as of 2026-07-28. Estimate figures are S&P Capital IQ consensus (vendor data — no filing page links). EPS and net income use the normalized (adjusted) consensus where the street reports it. Line-item analyst models (segments, drivers, KPIs) are in the Visible Alpha tab.
Traceability
525 of 526 figures on this page (100%) link to the filing page where they are printed — click a linked figure to open the source PDF at that page with the row highlighted. Unlinked figures come from standardized data feeds or pre-filing years.
Sportradar reports under IFRS in euros and files on Form 20-F as a foreign private issuer. All figures are in thousands of euros exactly as printed ('Expressed in thousands of Euros'). The Class A shares trade in US dollars on Nasdaq under SRAD.
FY2023-FY2025 income-statement, cash-flow and revenue-note figures come from the FY2025 Form 20-F; FY2022 from the FY2024 Form 20-F (income statement) and the FY2023 Form 20-F (balance sheet, cash flow, EPS); FY2021 from the FY2023 Form 20-F (income statement, cash flow) and the FY2021 Form 20-F (balance sheet). FY2019-FY2020 long-term figures are comparative columns of the FY2021 Form 20-F.
Expense presentation changed in the FY2024 Form 20-F: 'Purchased services and licenses' and a single 'Depreciation and amortization' line were re-presented as 'Sport rights expenses (including amortization of capitalized sport rights licenses)', 'Purchased services' and 'Depreciation and amortization (excluding amortization of capitalized sport rights licenses)'. FY2022-FY2025 are shown on the new basis; FY2021 was never re-presented, so those three rows are blank for FY2021. As originally printed in the FY2023 Form 20-F (p.132), FY2021 showed Purchased services and licenses of (119,426) and Depreciation and amortization of (129,375).
The Betting Technology and Solutions / Sports Content, Technology and Services revenue grouping was introduced in the FY2024 Form 20-F and disclosed back to FY2022 only. FY2021 revenue was reported on the earlier Rest of the World Betting / Betting AV / United States basis (RoW Betting 309,357; Betting AV 140,162; United States 71,700; Other 39,983) and is left blank in the product-group table.
Effective January 1, 2024 Sportradar has a single operating and reportable segment, so no segment-profit statement is shown. Adjusted EBITDA, Adjusted EBITDA margin and Customer Net Retention Rate are the company's own headline non-IFRS/operating metrics and are taken from the 'Key Financial and Operational Performance Indicators' tables. The FY2021-FY2022 retention figures were printed under the label 'Net Retention Rate'.
Balance-sheet row labels are disambiguated where a filing prints the same caption twice: 'Trade and other payables (current)' is printed as 'Trade payables' in the FY2021-FY2024 filings and as 'Trade and other payables' in the FY2025 Form 20-F; 'Trade payables (non-current)' is the sport rights license payable; 'Loans and borrowings (non-current)' is the second of the two loans-and-borrowings lines.
FY2019 total equity is the only long-term cell taken from the standardized data feed (the FY2021 Form 20-F balance sheet shows only 2020 and 2021) and carries no page link.
Quarterly income statements and balance sheets are printed as single-quarter / point-in-time columns in Sportradar's quarterly results releases and are cited directly. Quarterly cash flows are printed year-to-date, so Q2 FY25, Q3 FY25, Q4 FY25 and Q4 FY24 are the exact difference between consecutive printed year-to-date statements; Q1 FY25 and Q1 FY26 are printed three-month figures. The run carries no quarterly cash-flow feed file, so no independent numeric cross-check of the derived quarters was possible; each subtraction reconciles exactly to the two printed year-to-date figures.
3 figure(s) differed between the data feed and the filing; the filing value is shown (see the run's metrics/metrics_tab.json for the audit trail).
Sportradar Group AG's management explains the business in its own materials. The slides below do the most of that work, pulled from the documents preserved in Sources. Each source link opens the complete presentation at that slide in a new tab.
Investor Day 2025 — 2025
Management's fullest account of the business: what it sells, to whom, how the pricing works, and the 2027 targets it set for itself. · Open the full document →
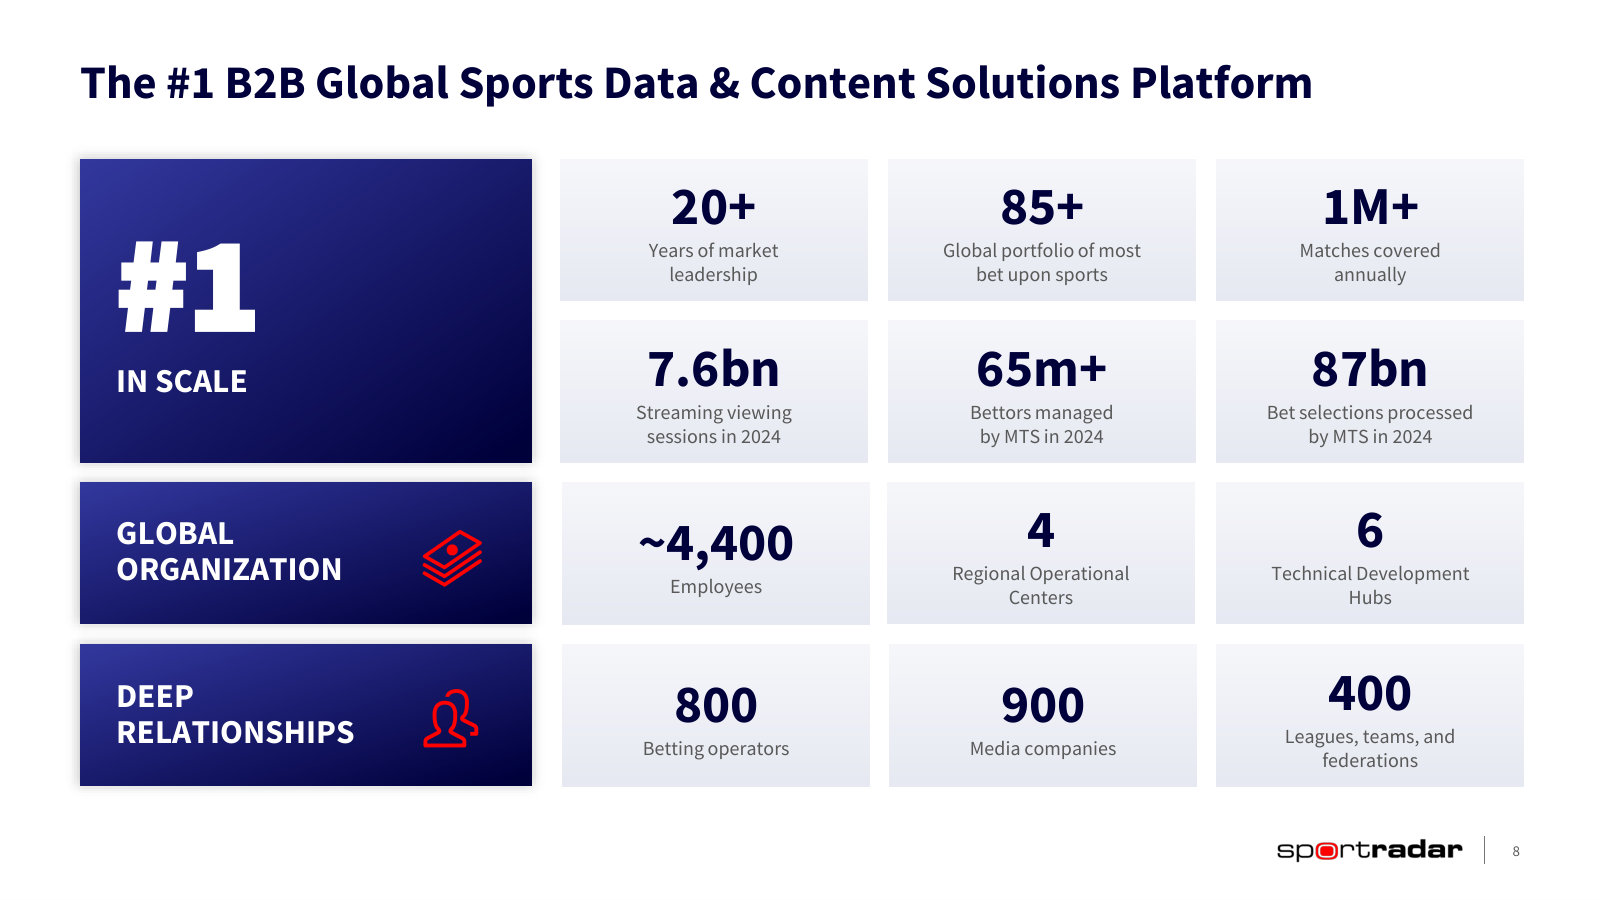
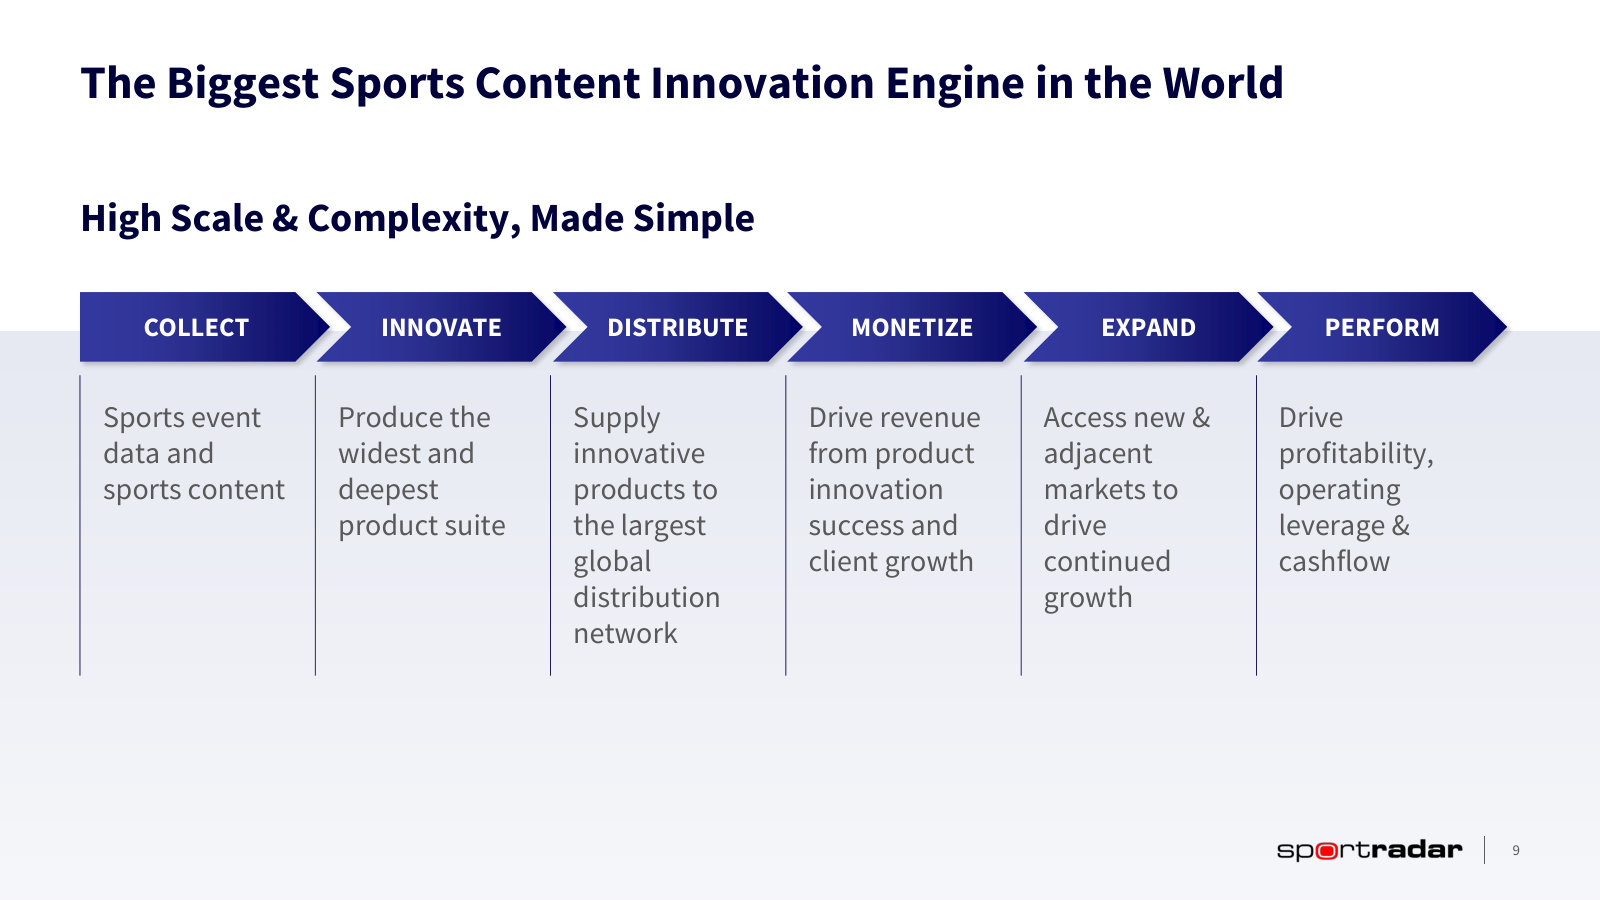
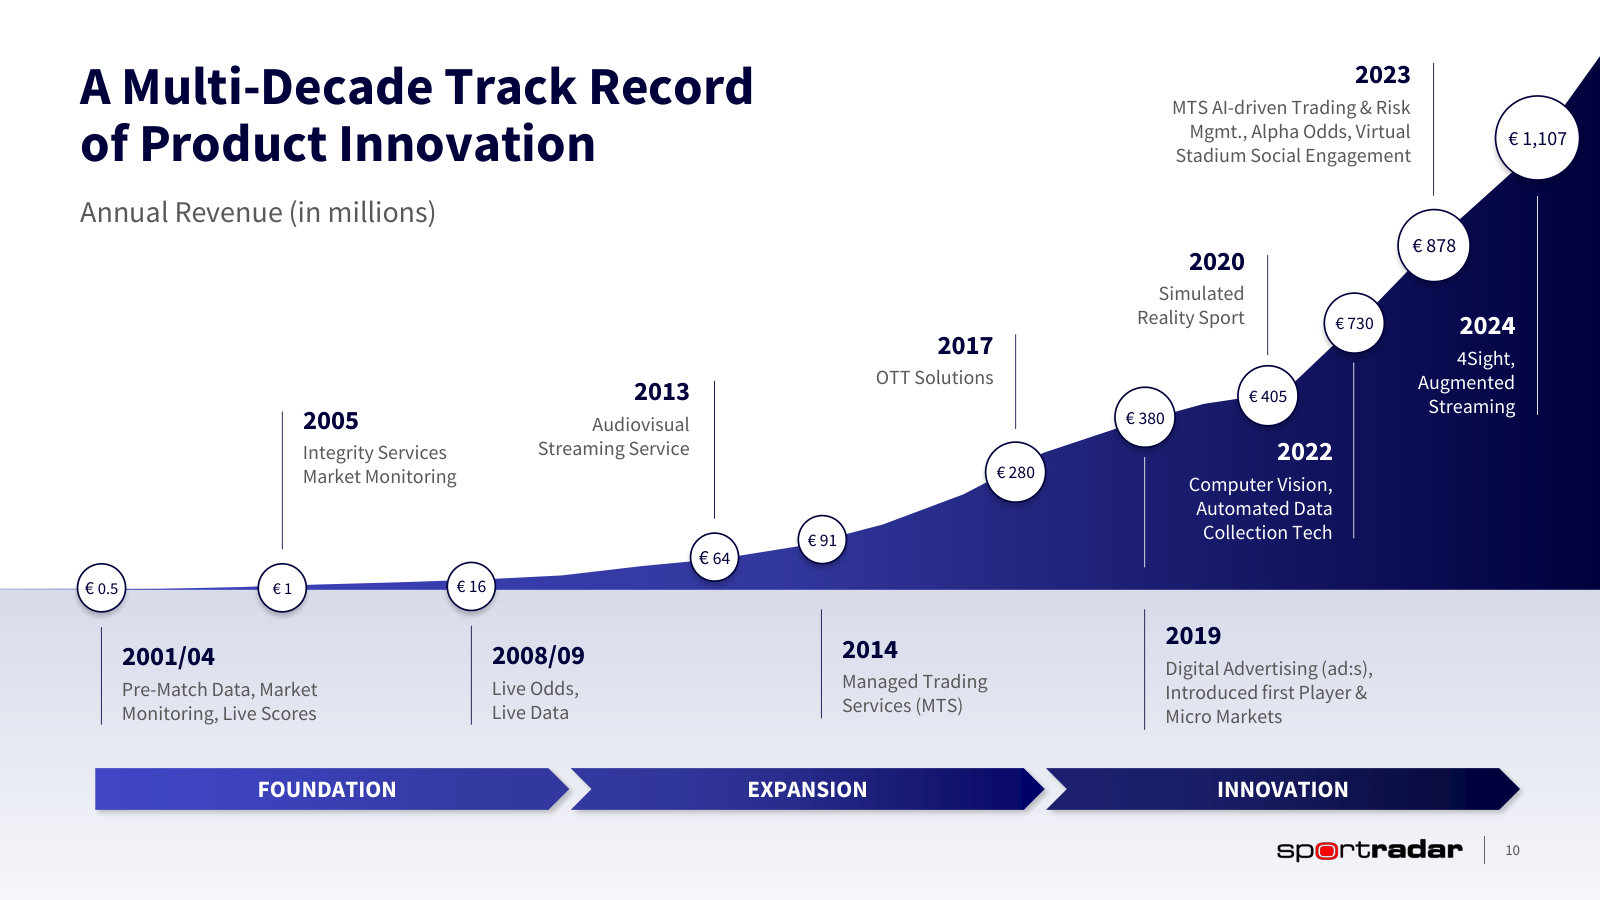
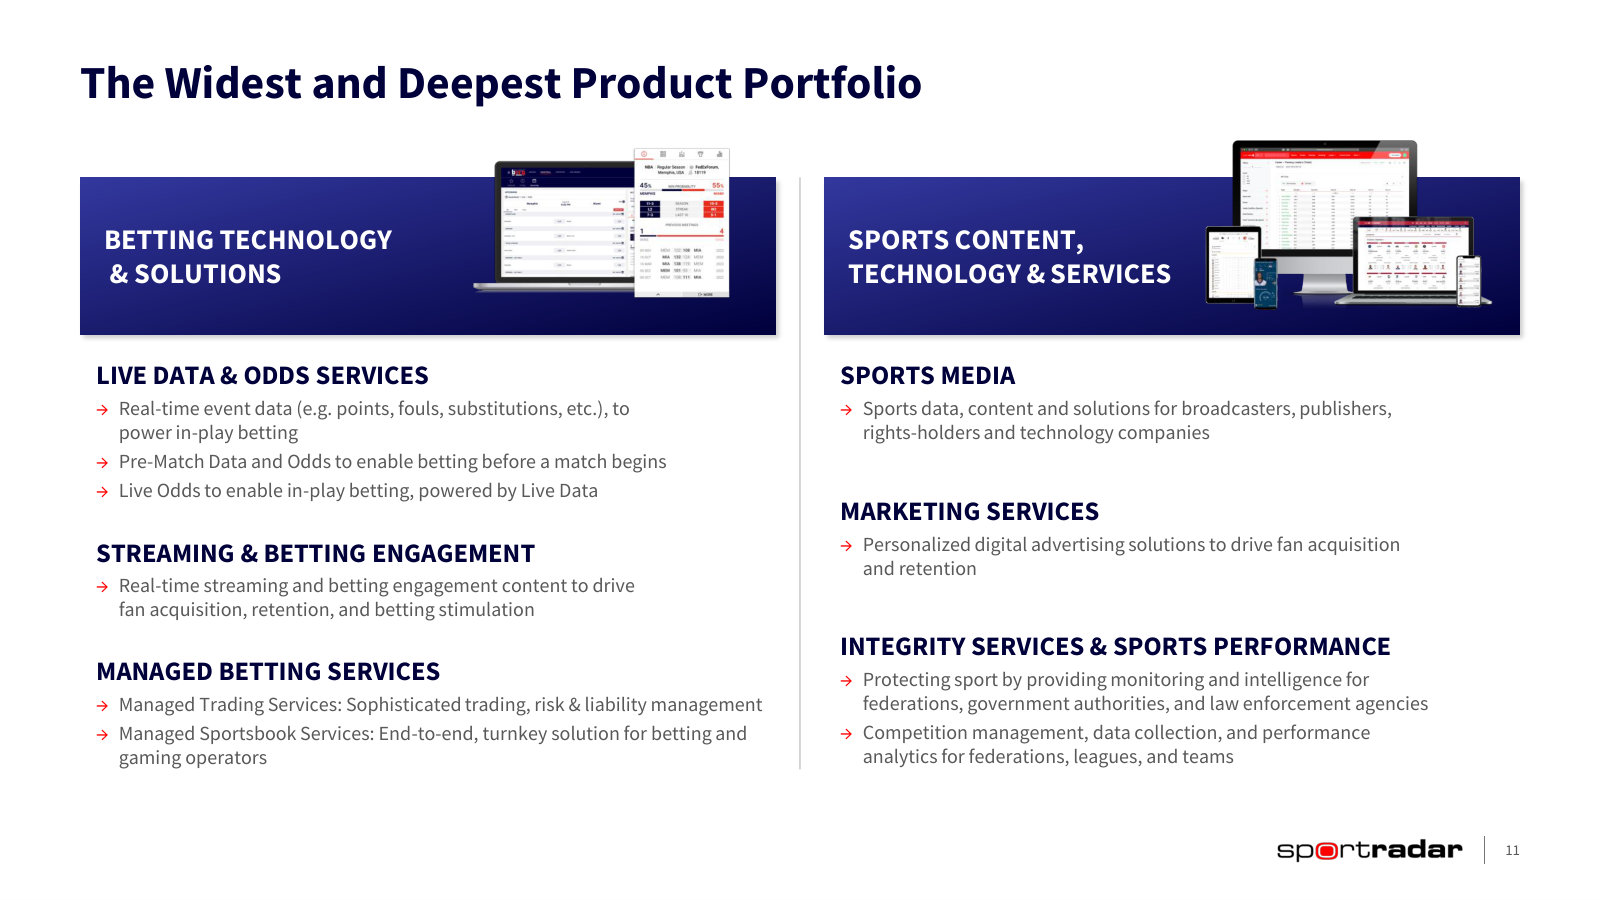
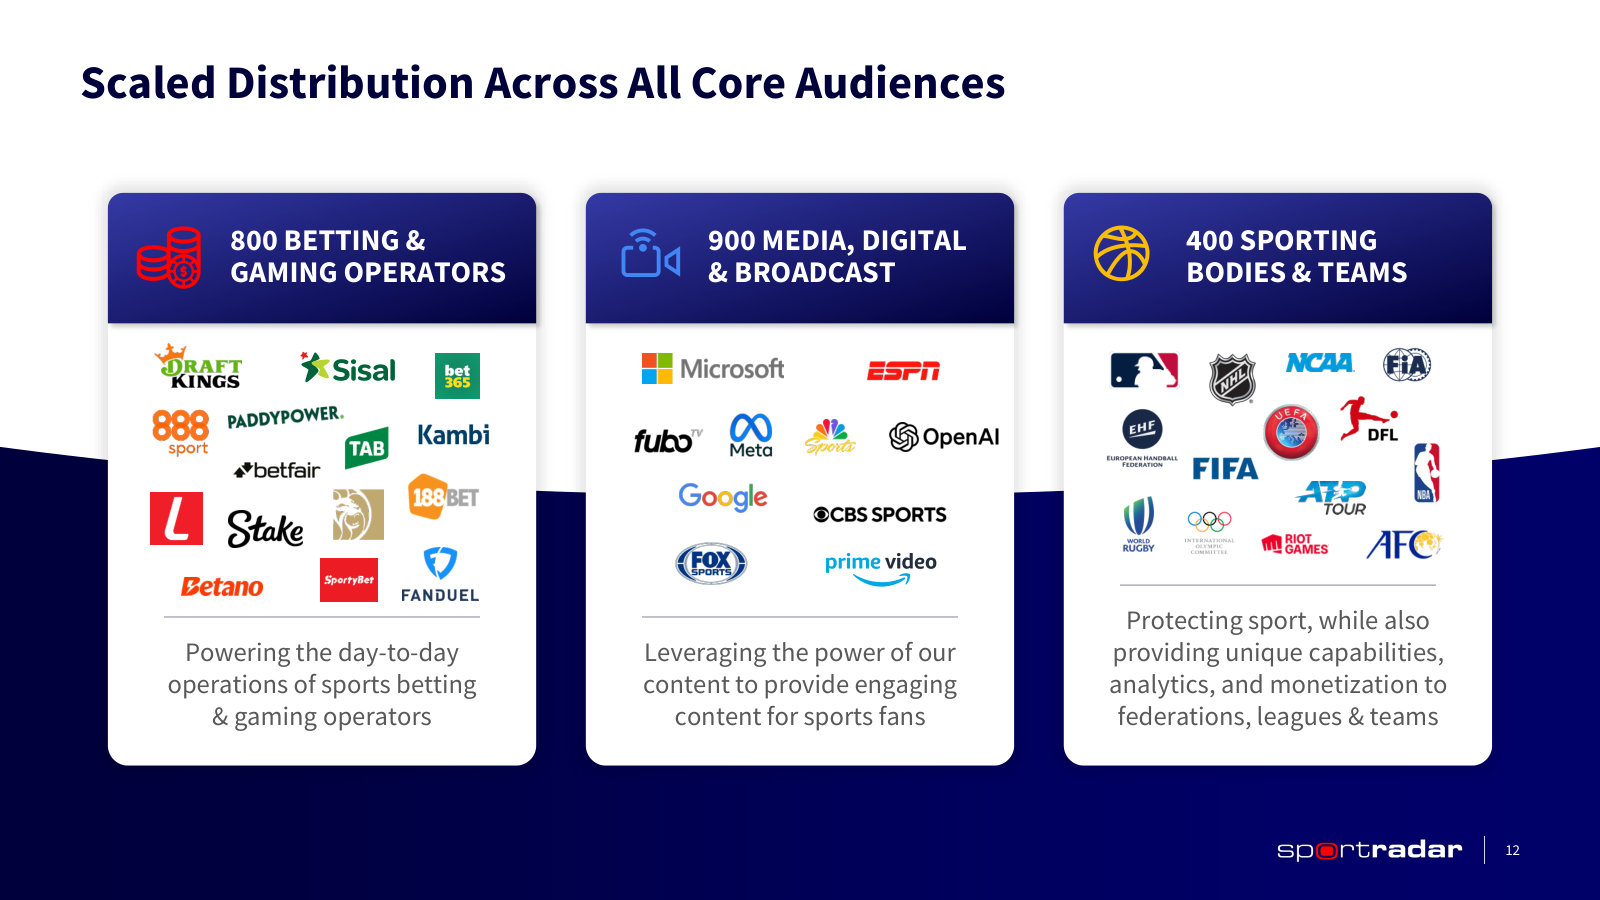
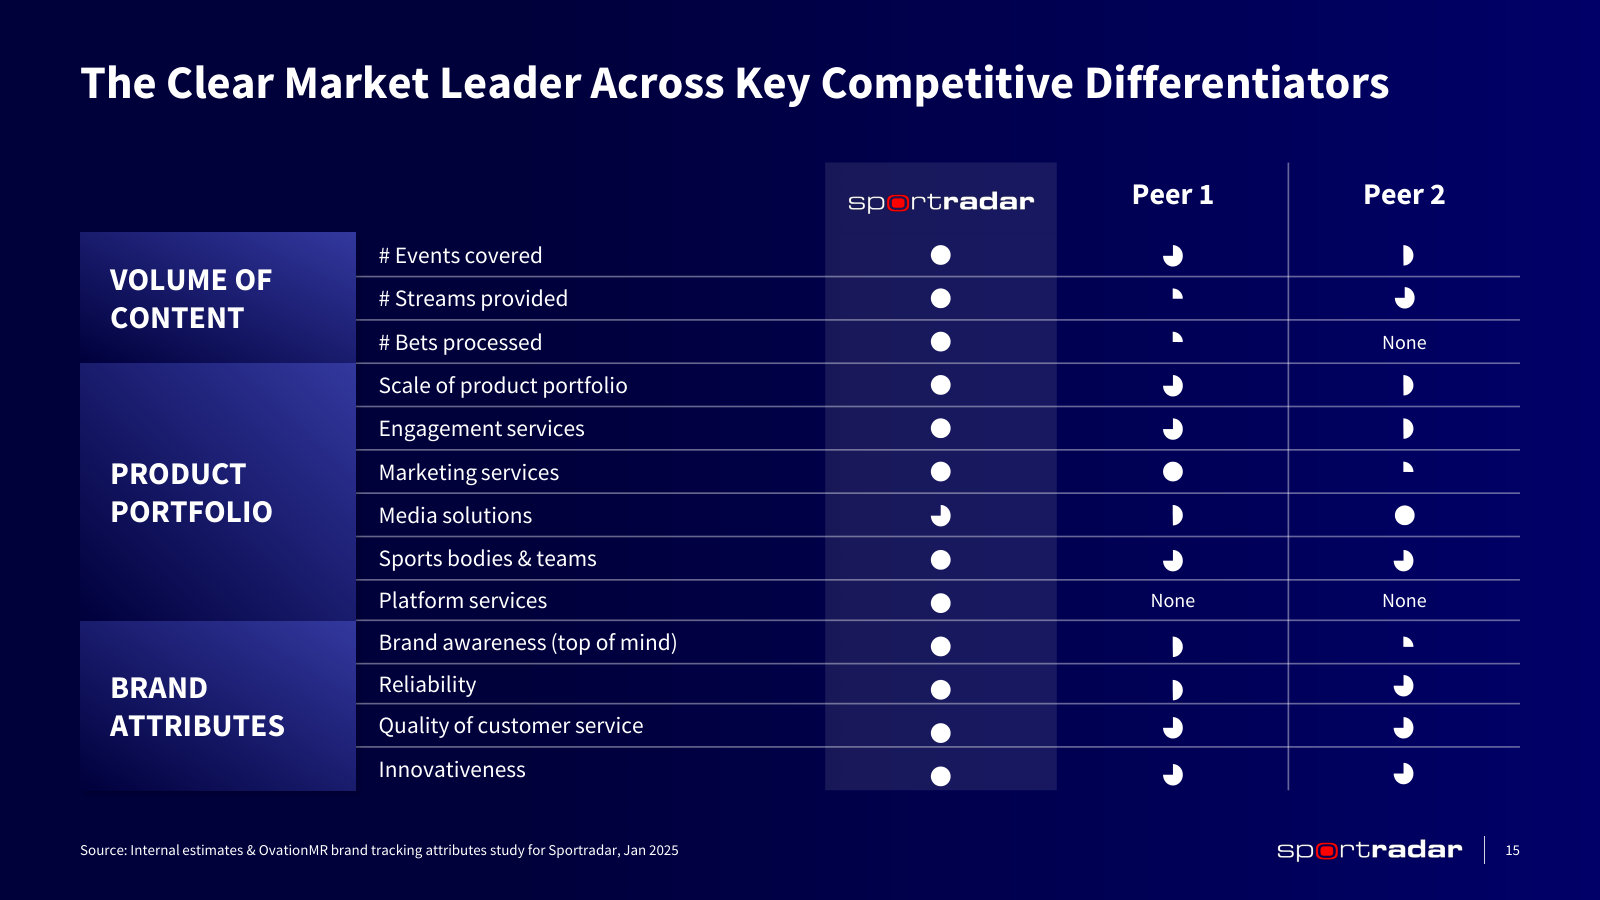
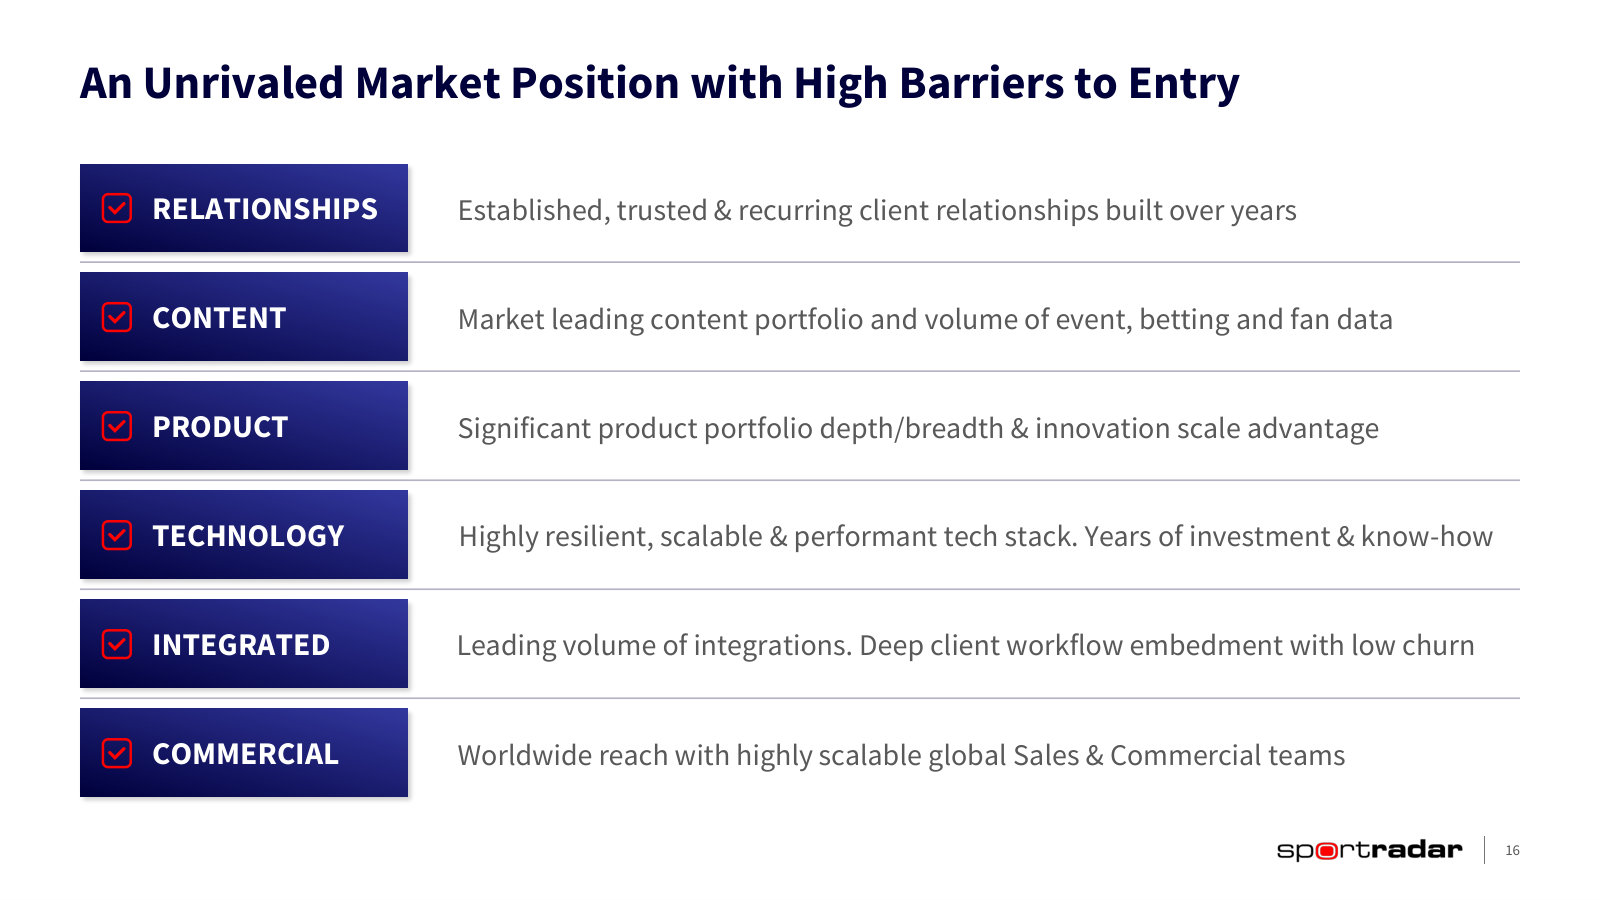
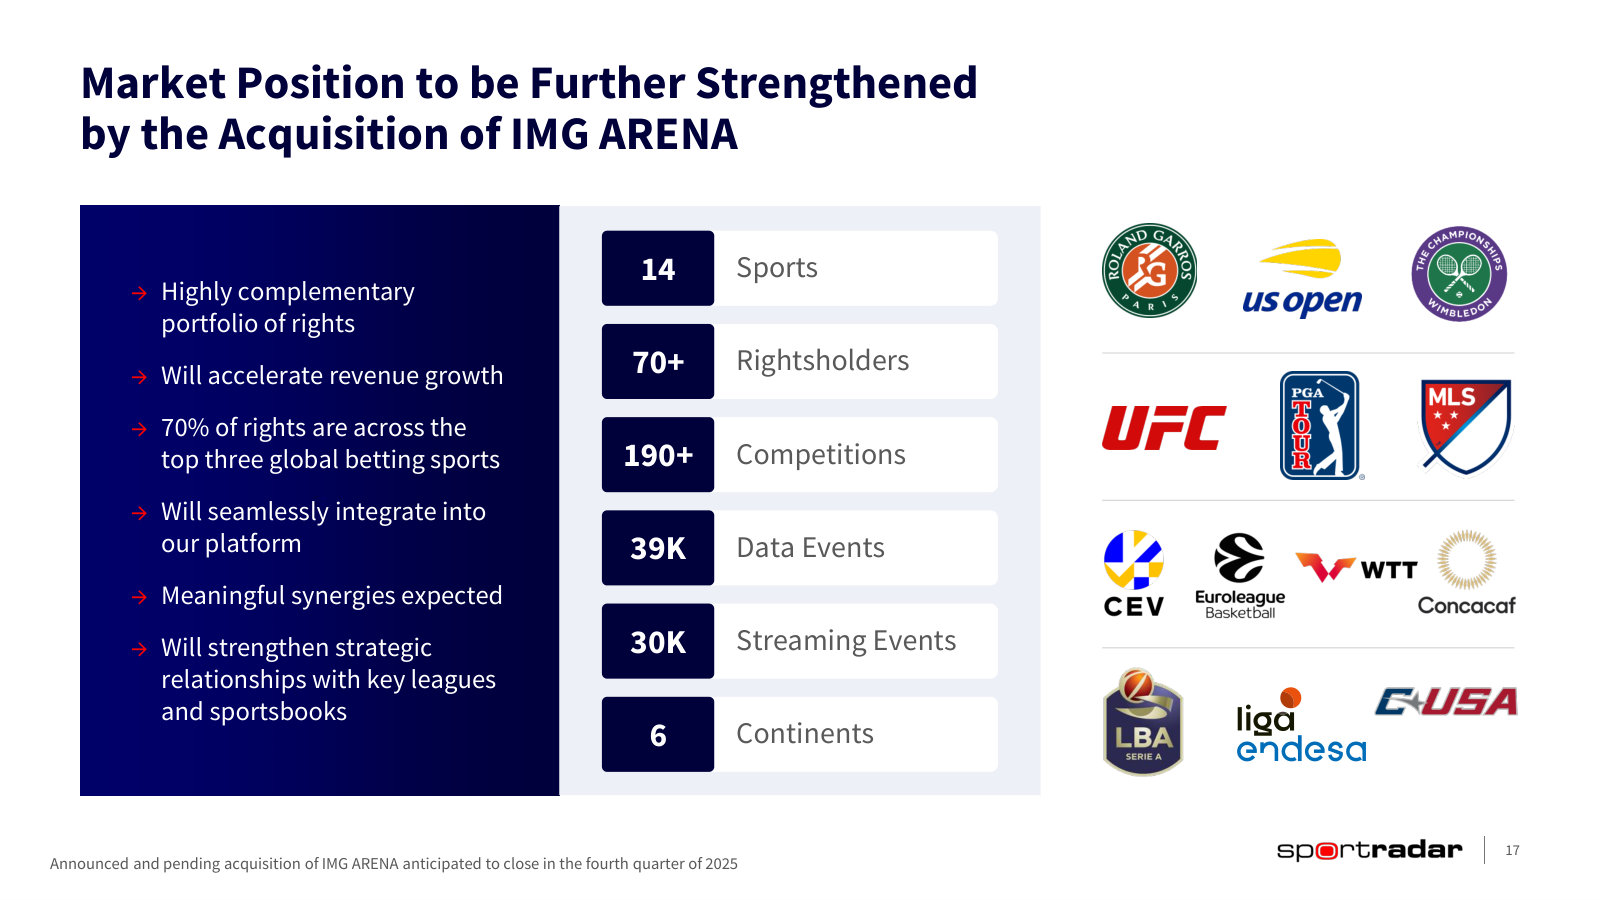
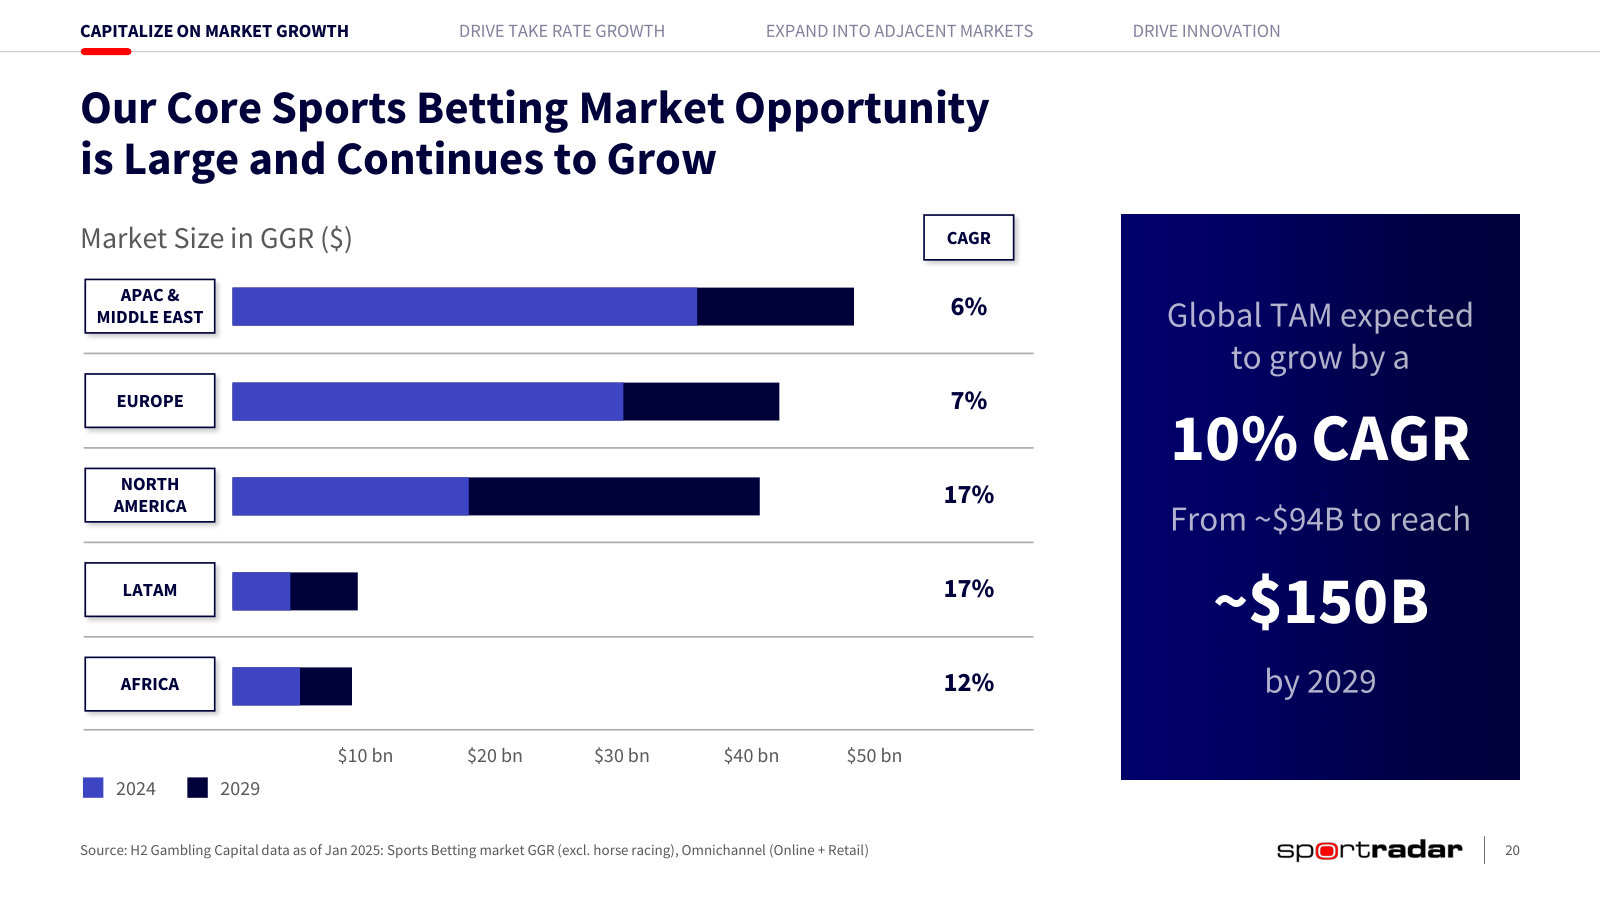
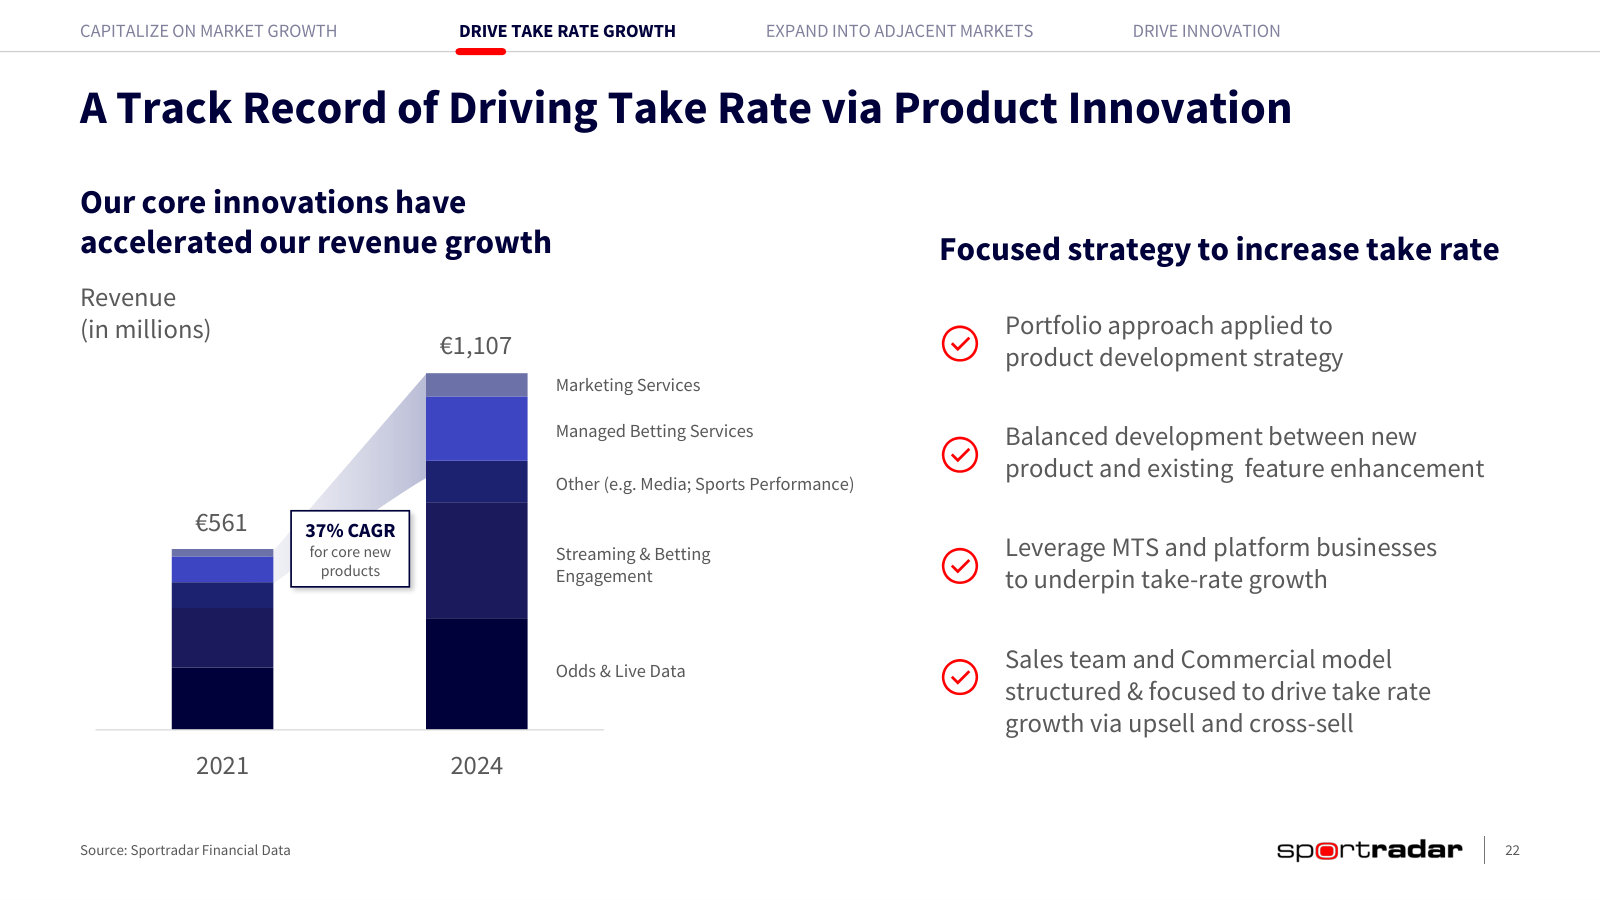
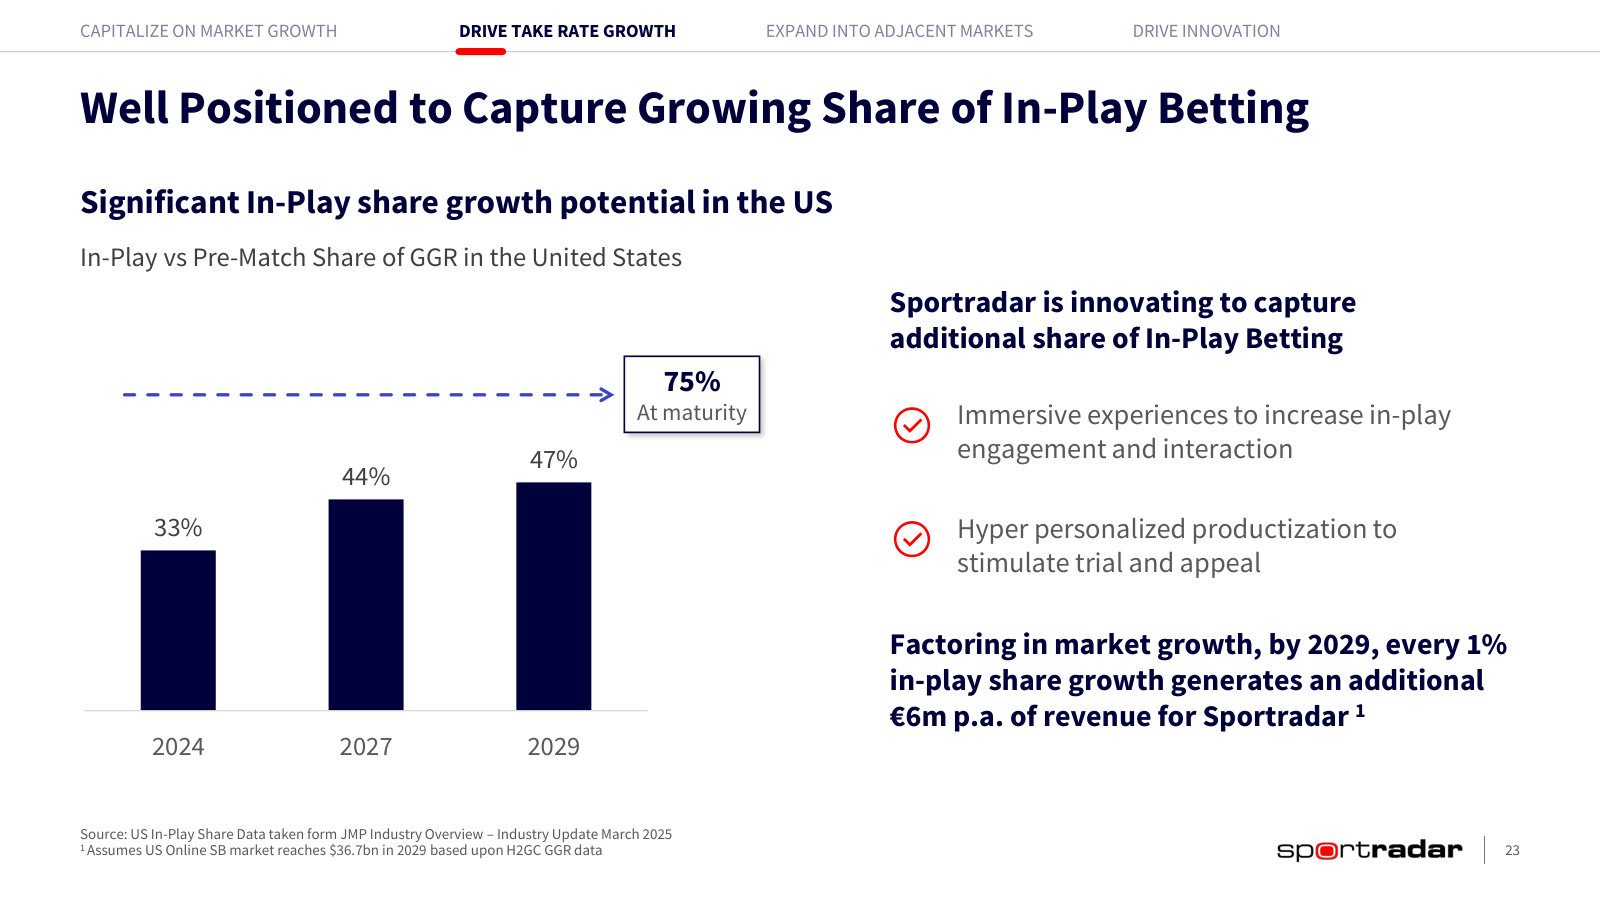
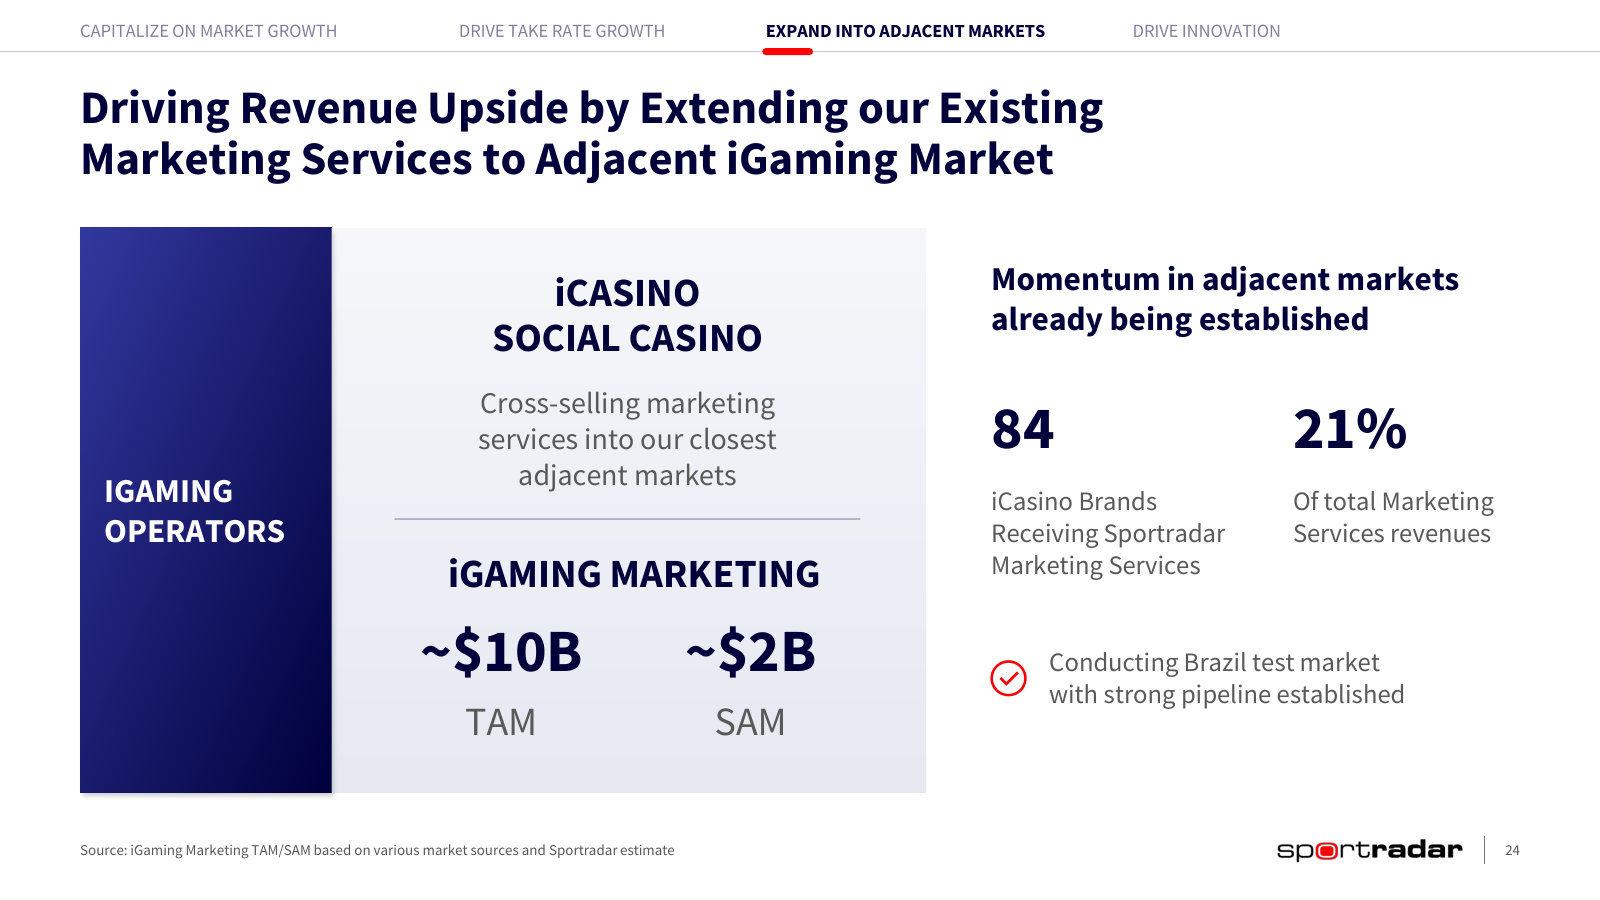
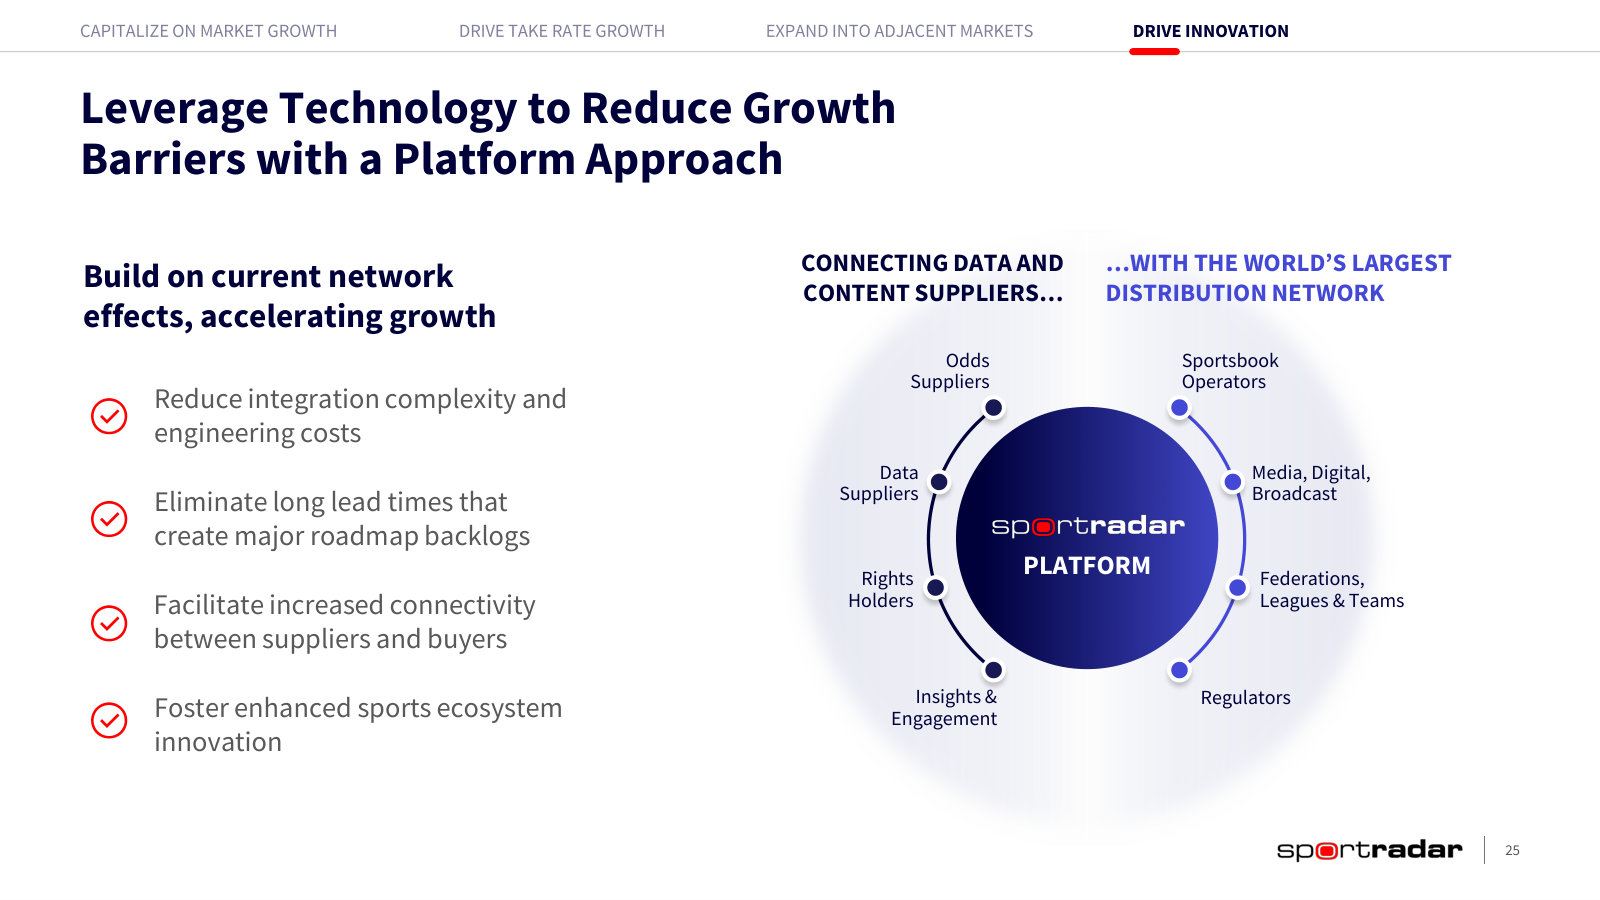
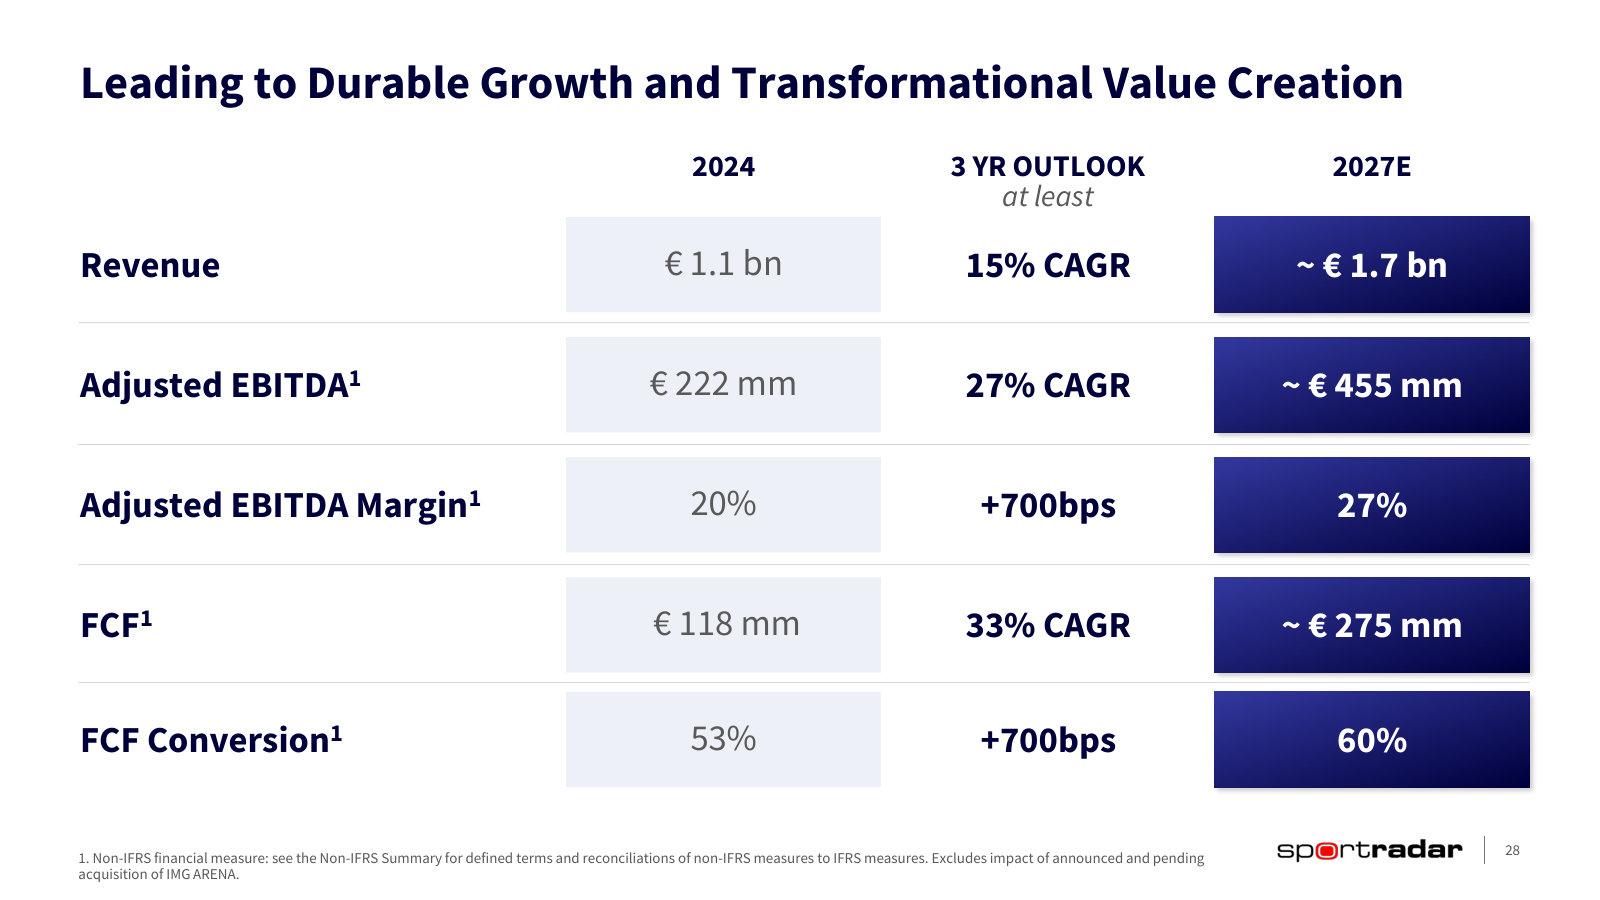
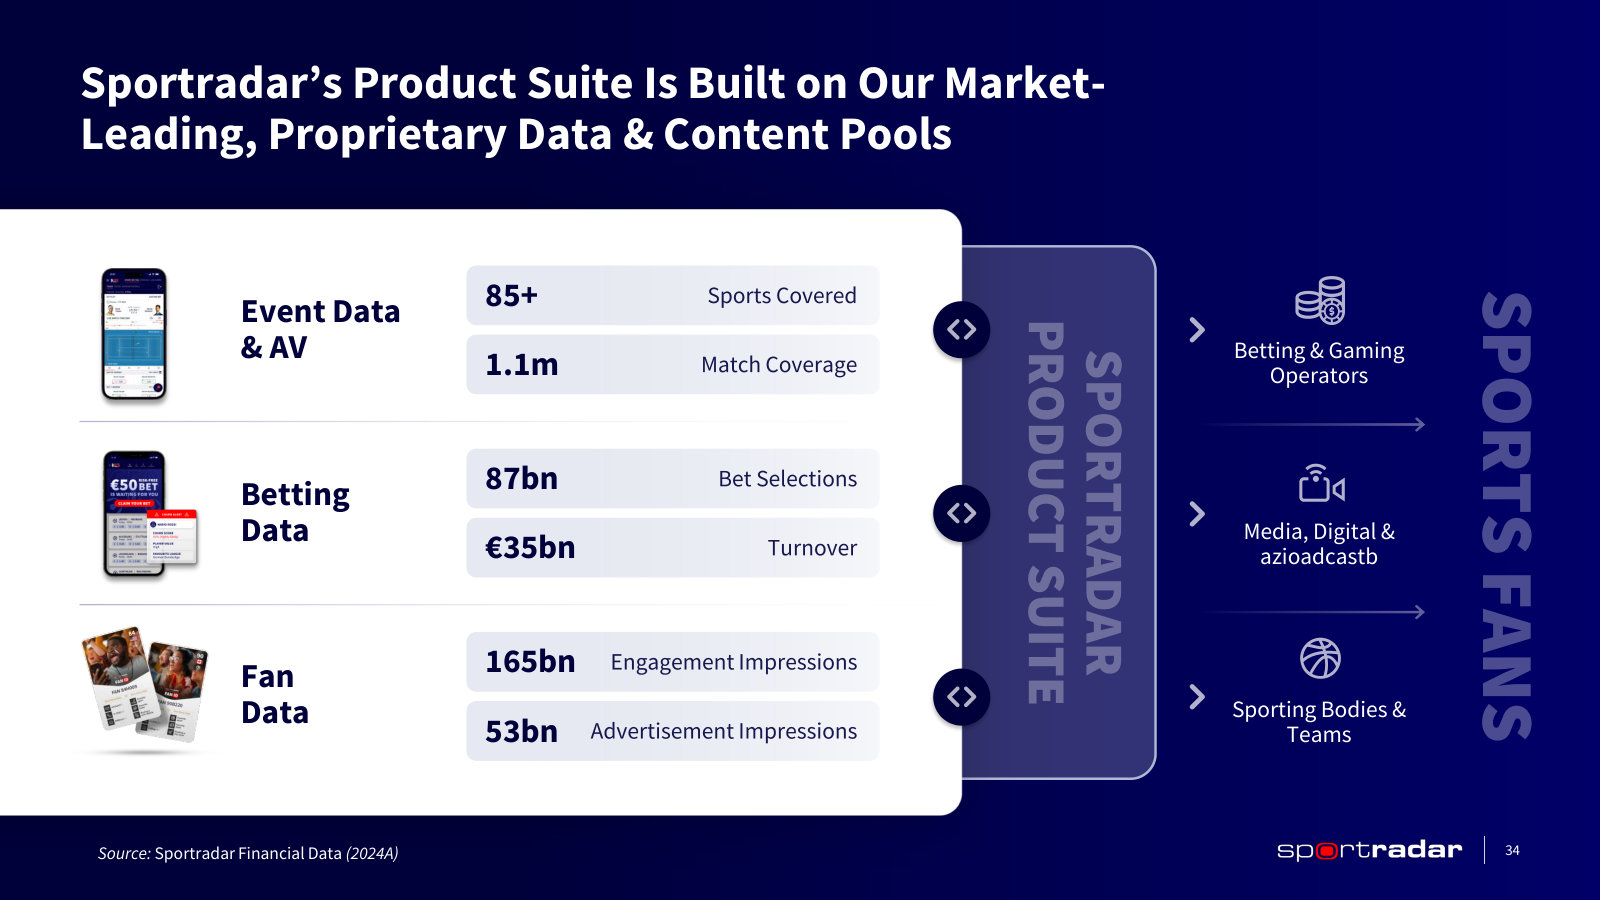
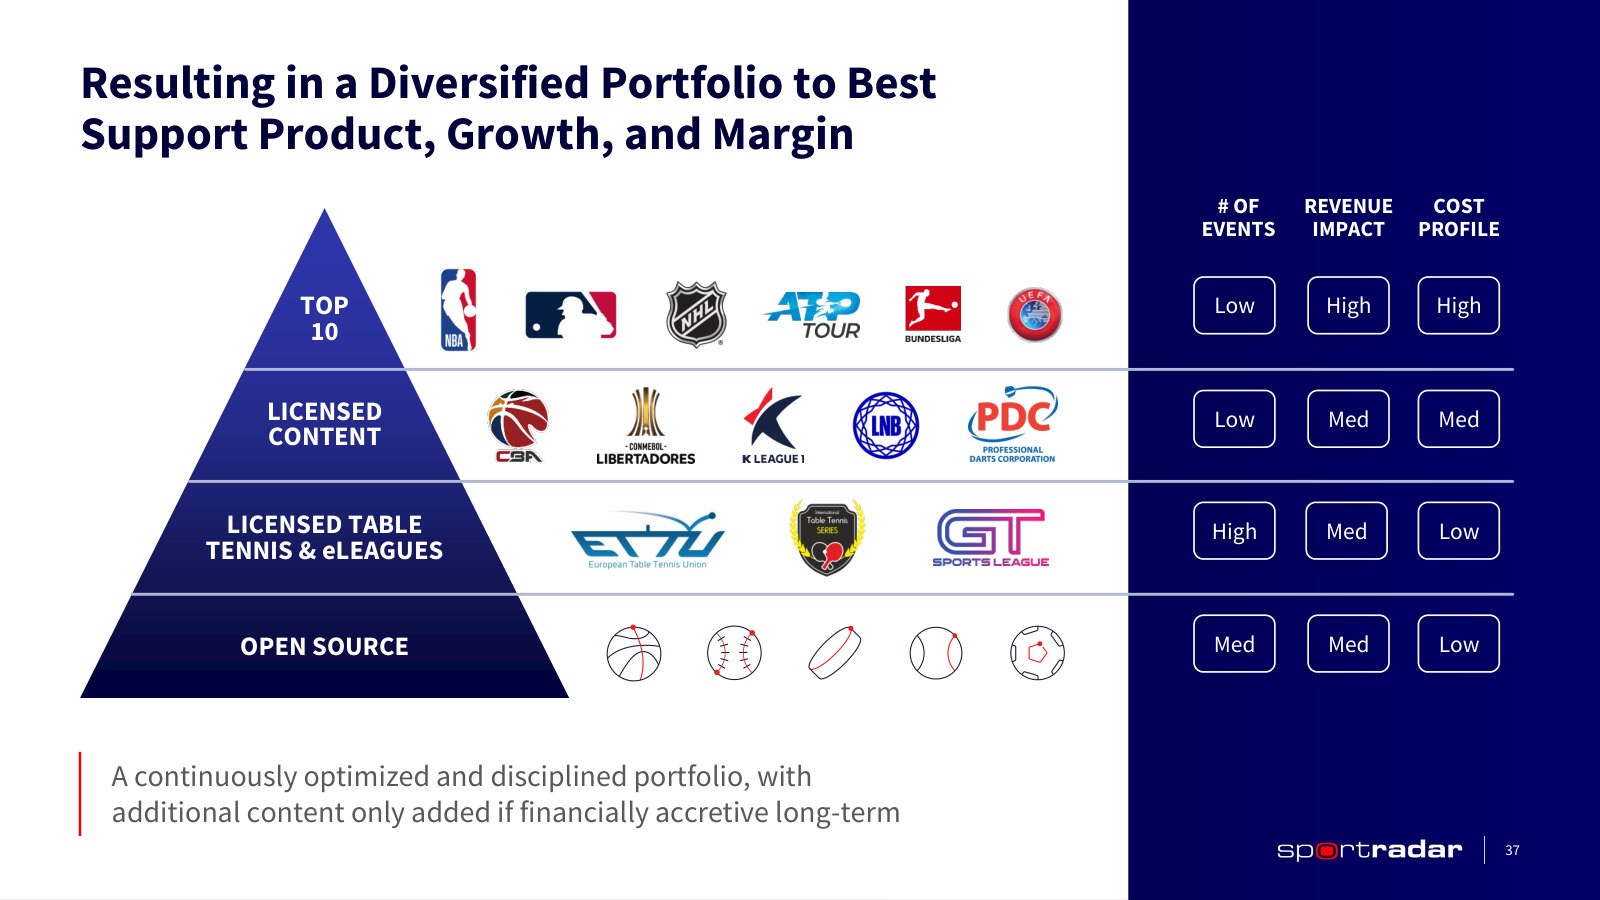
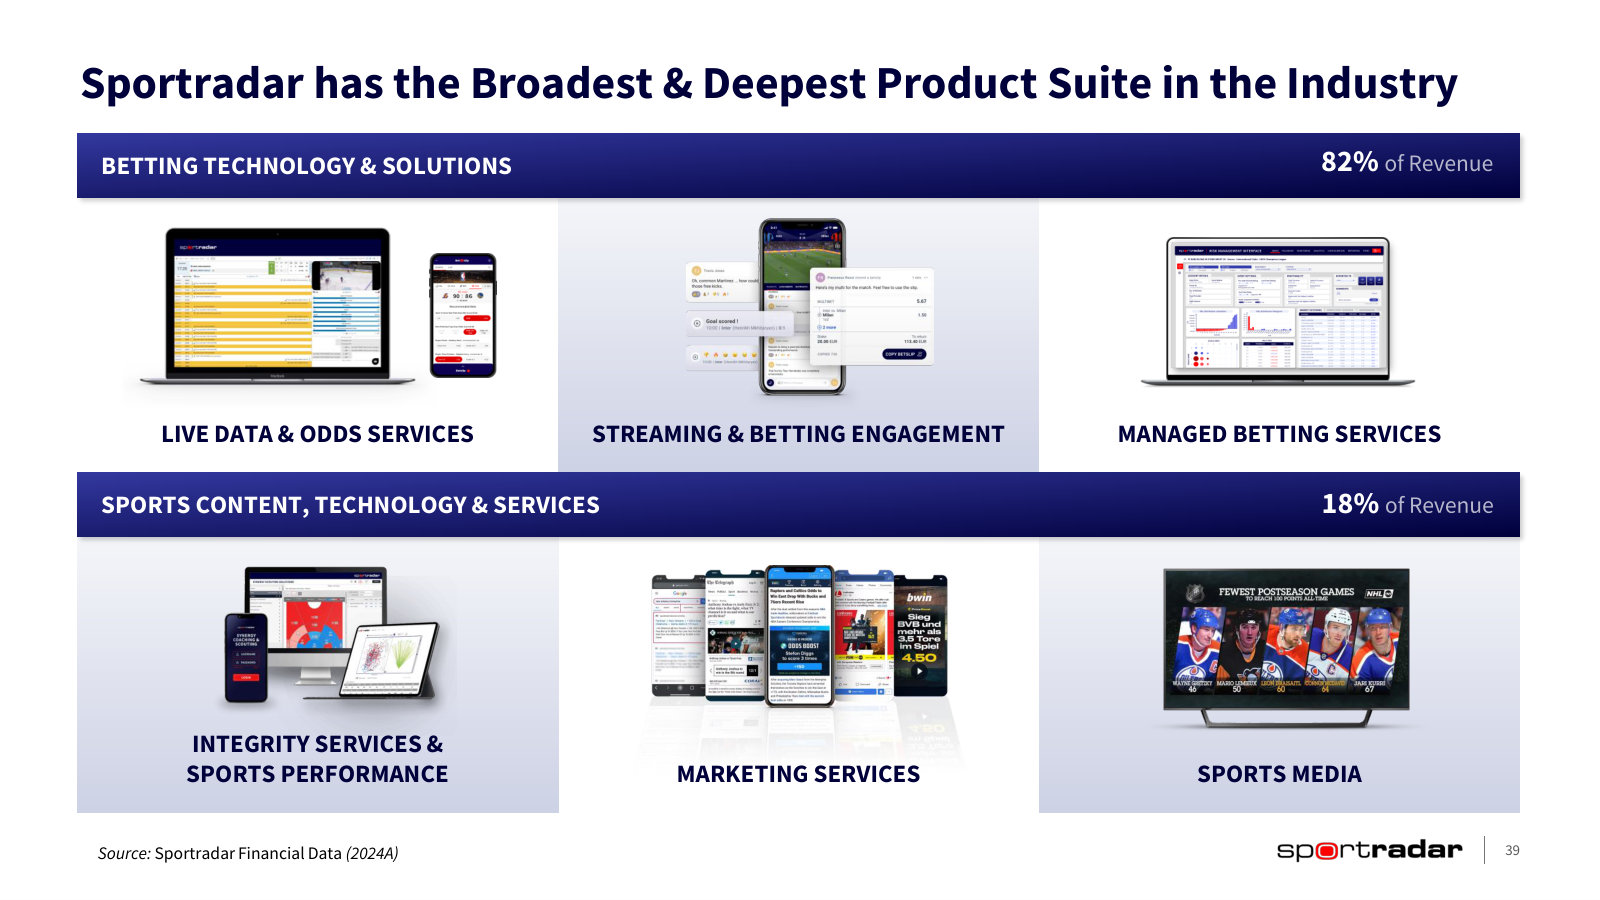
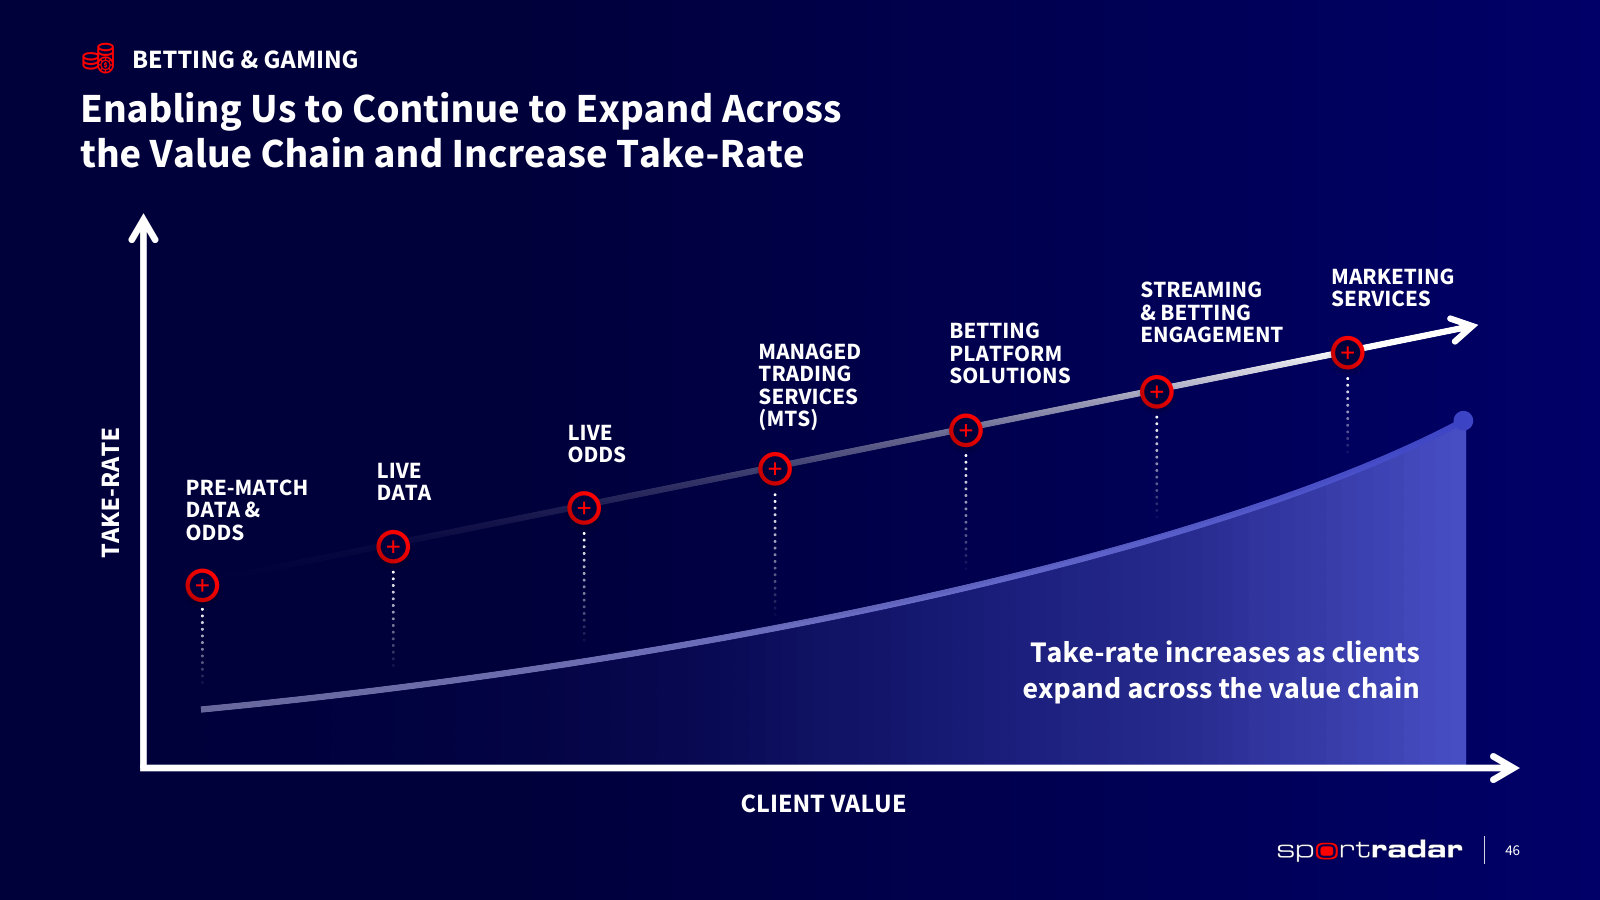
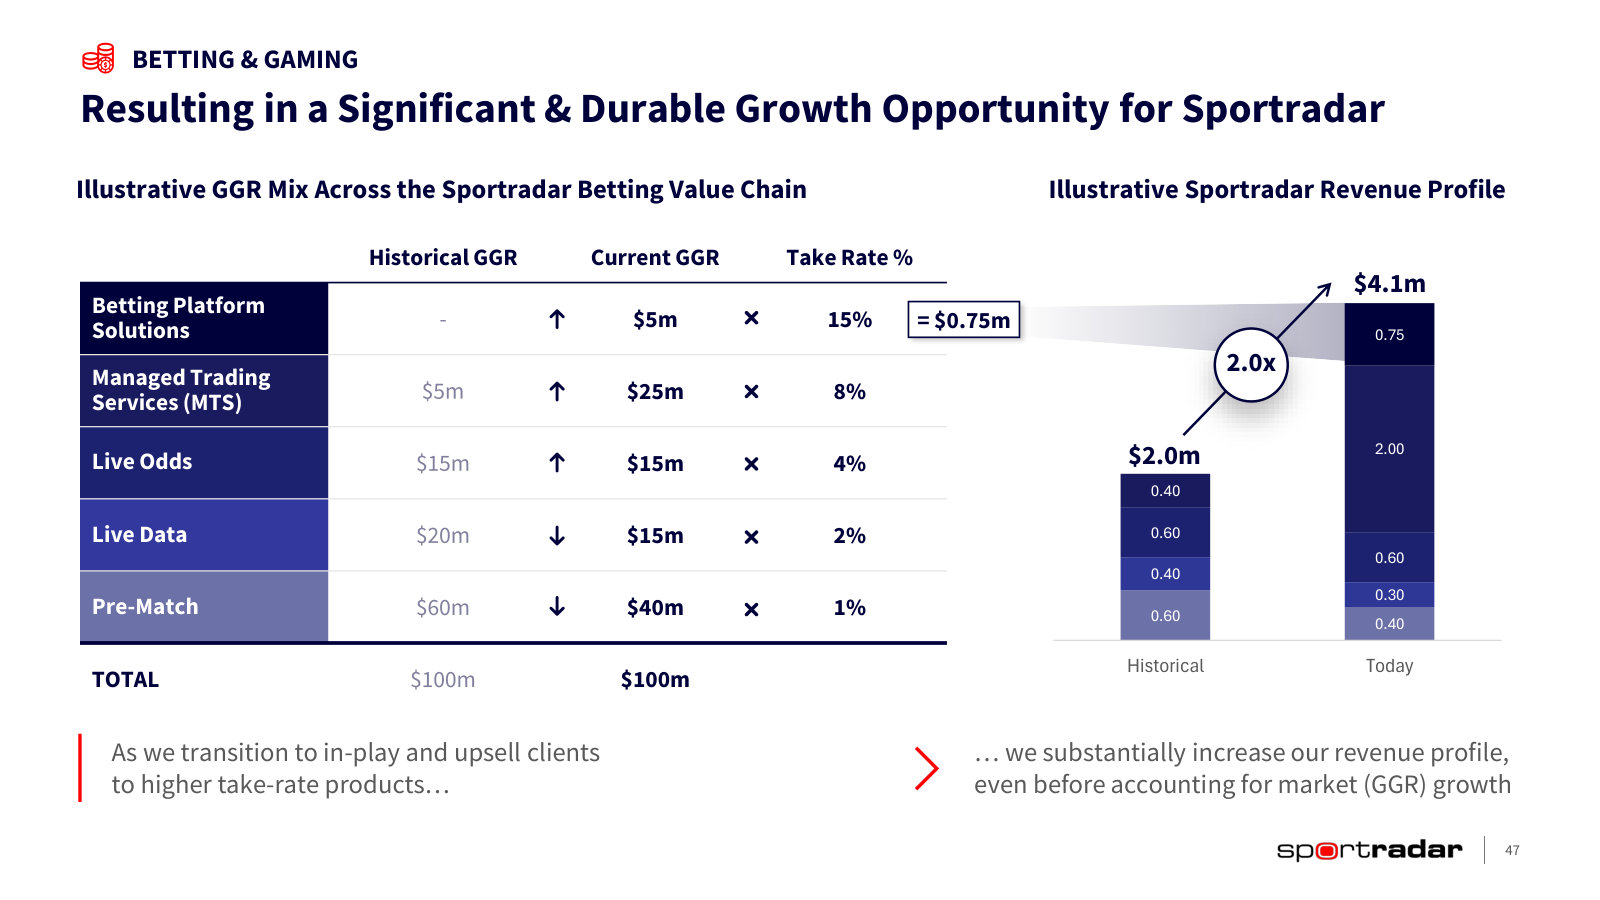
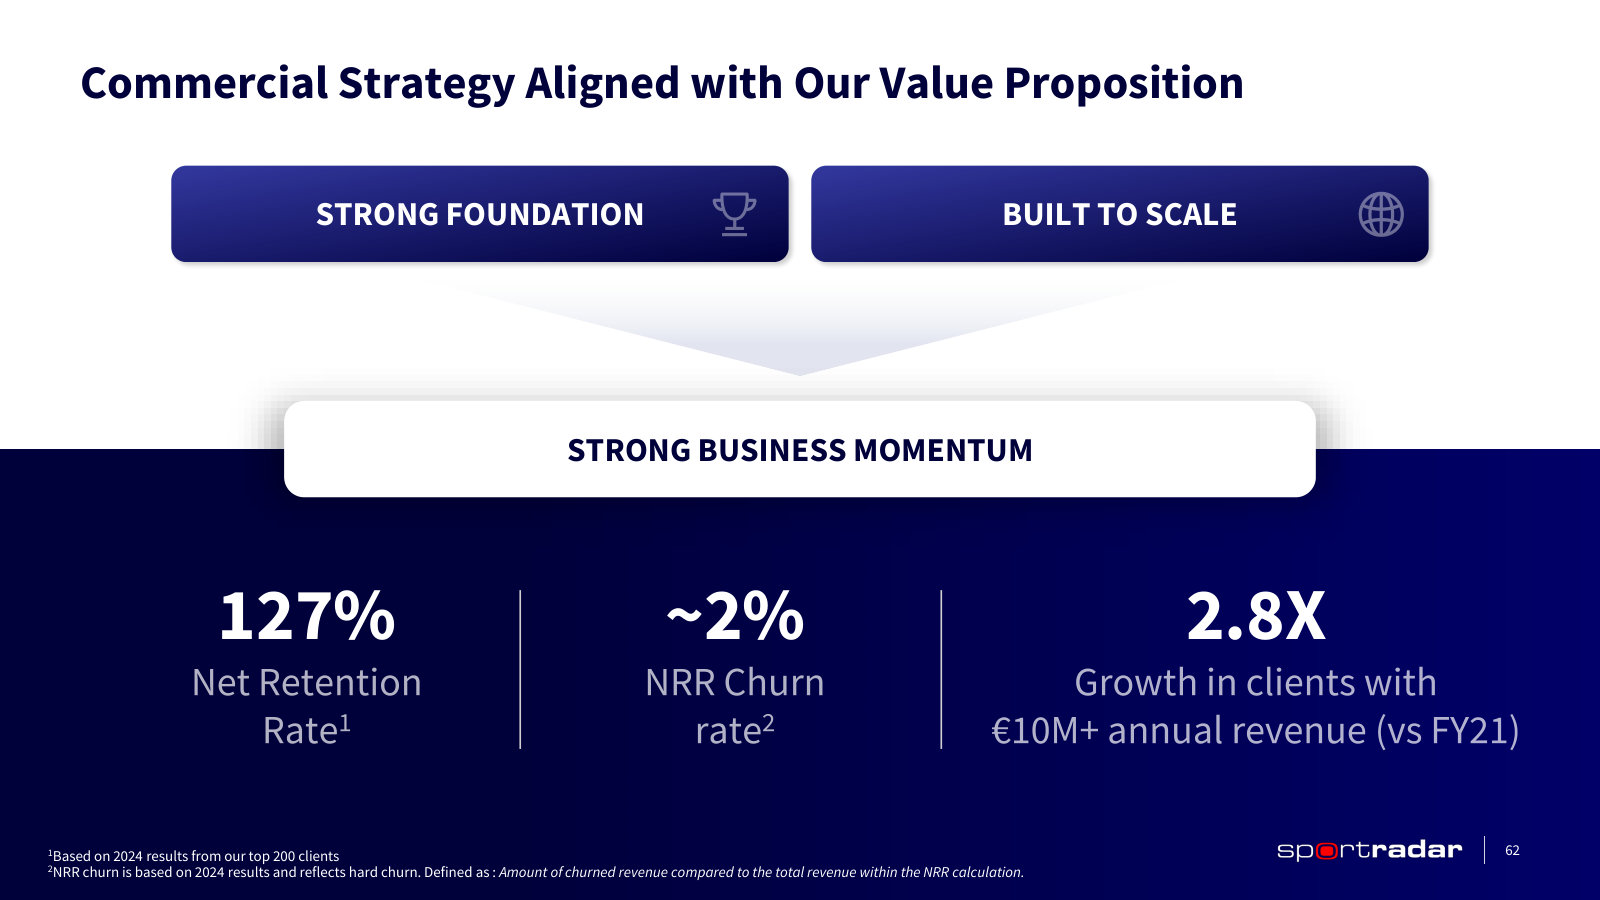
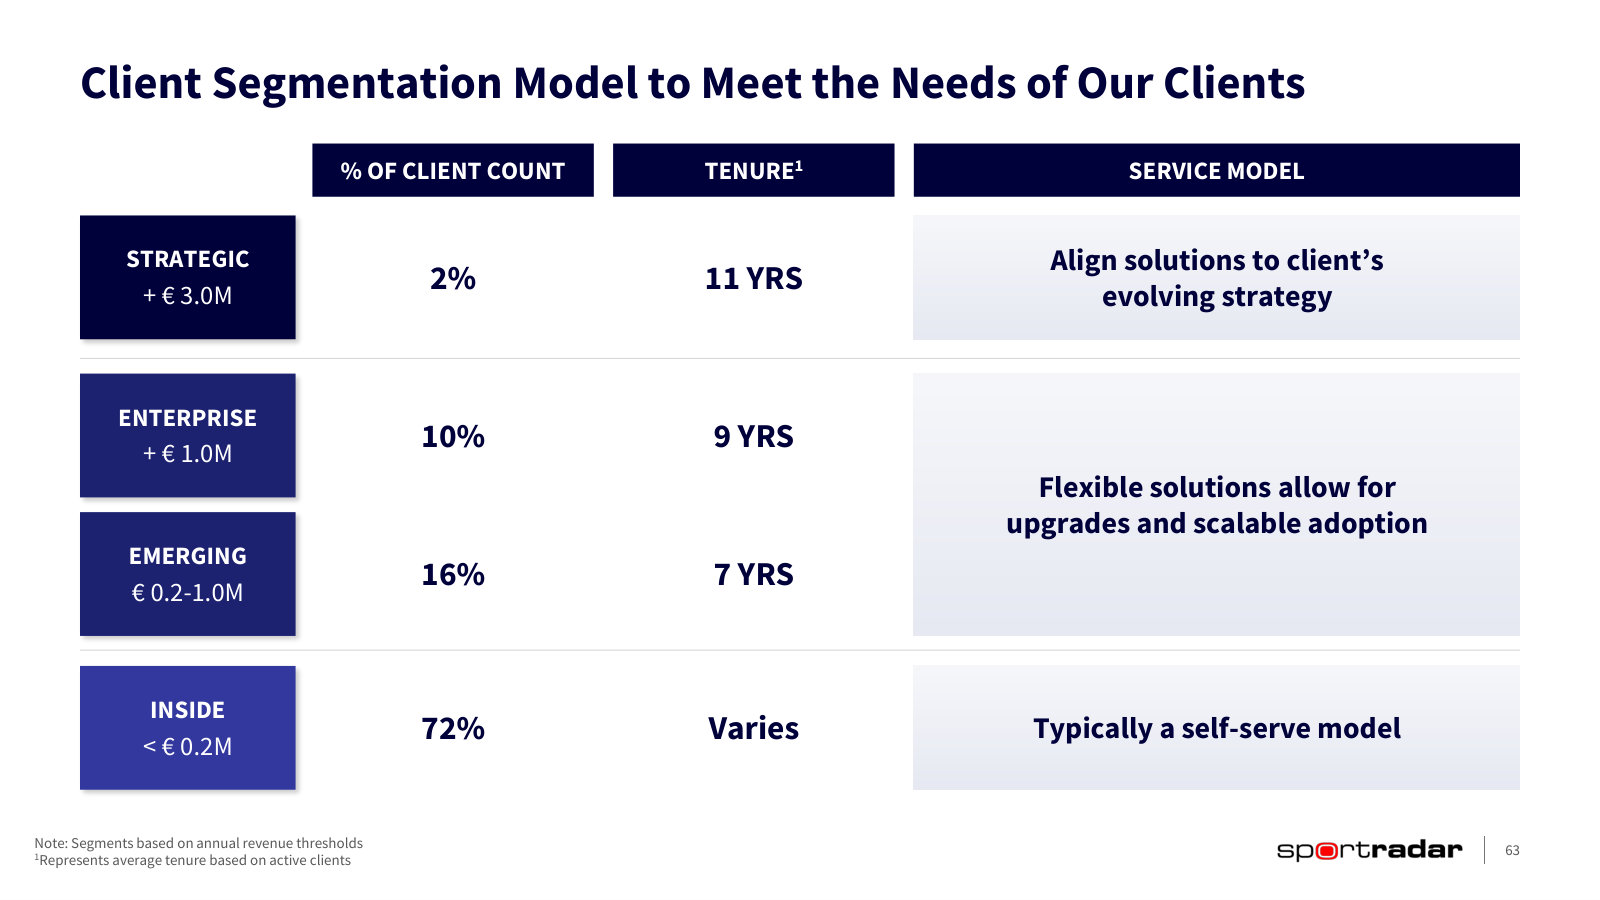
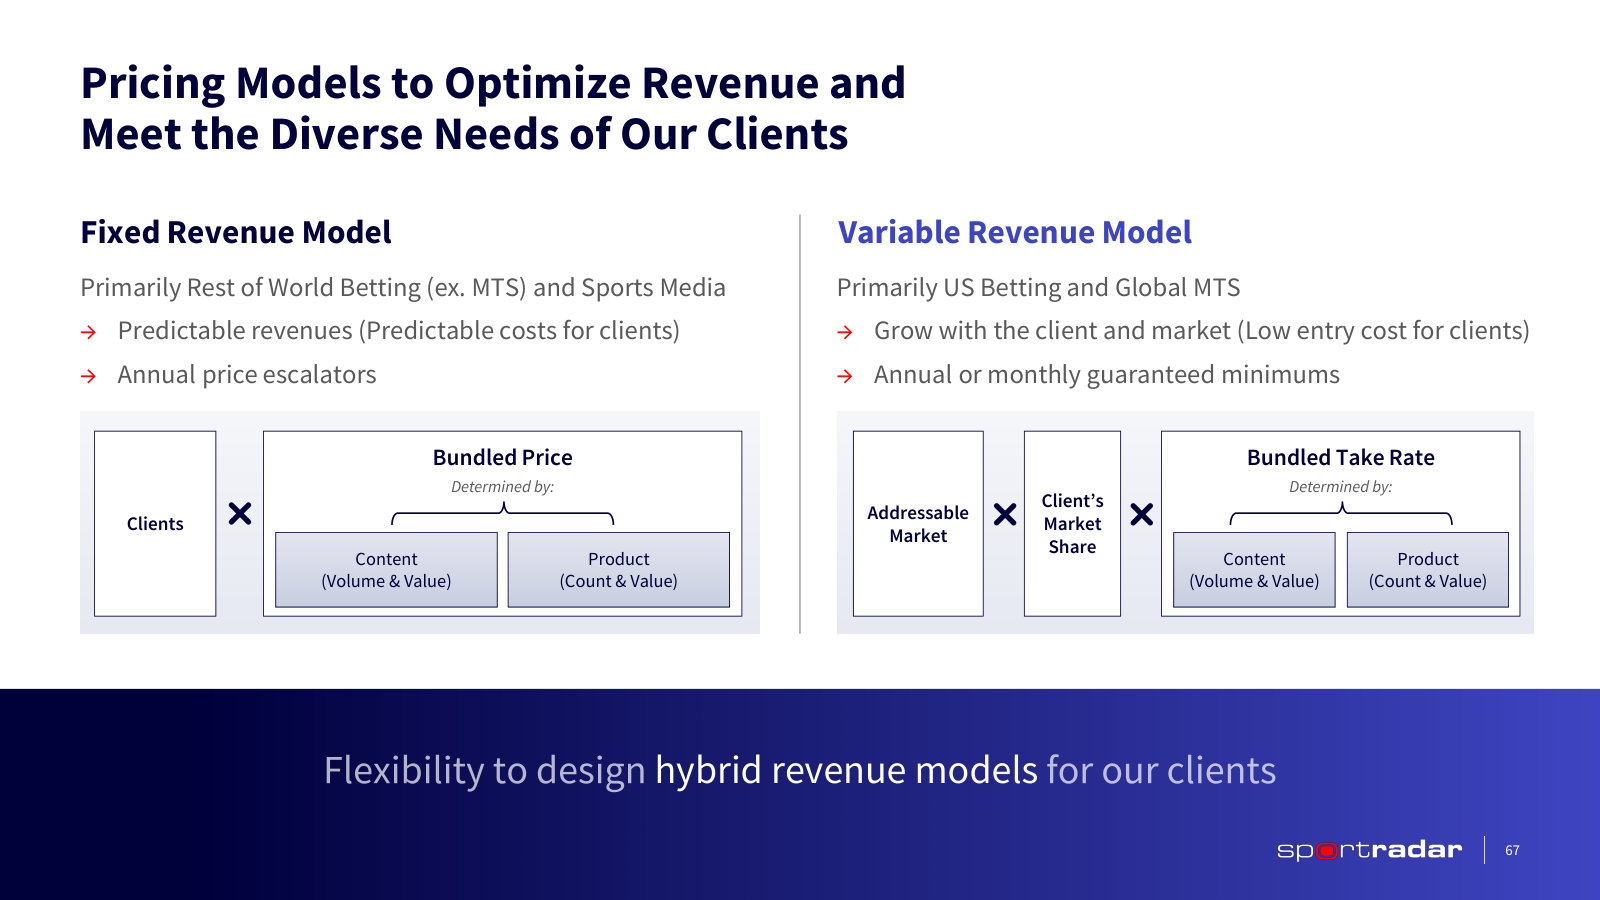
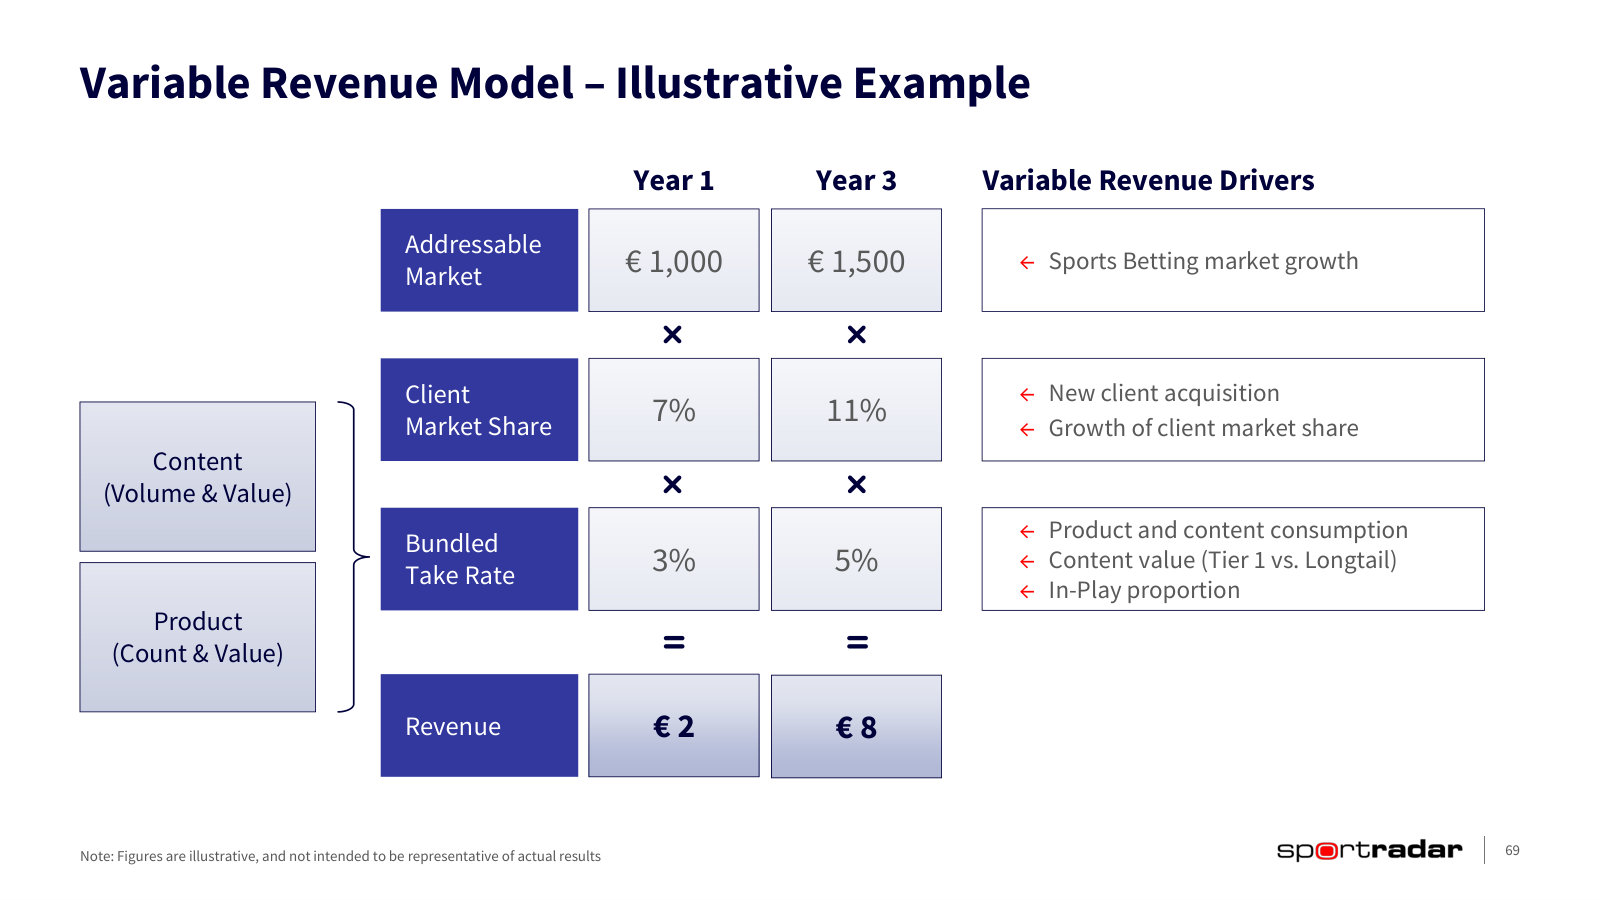
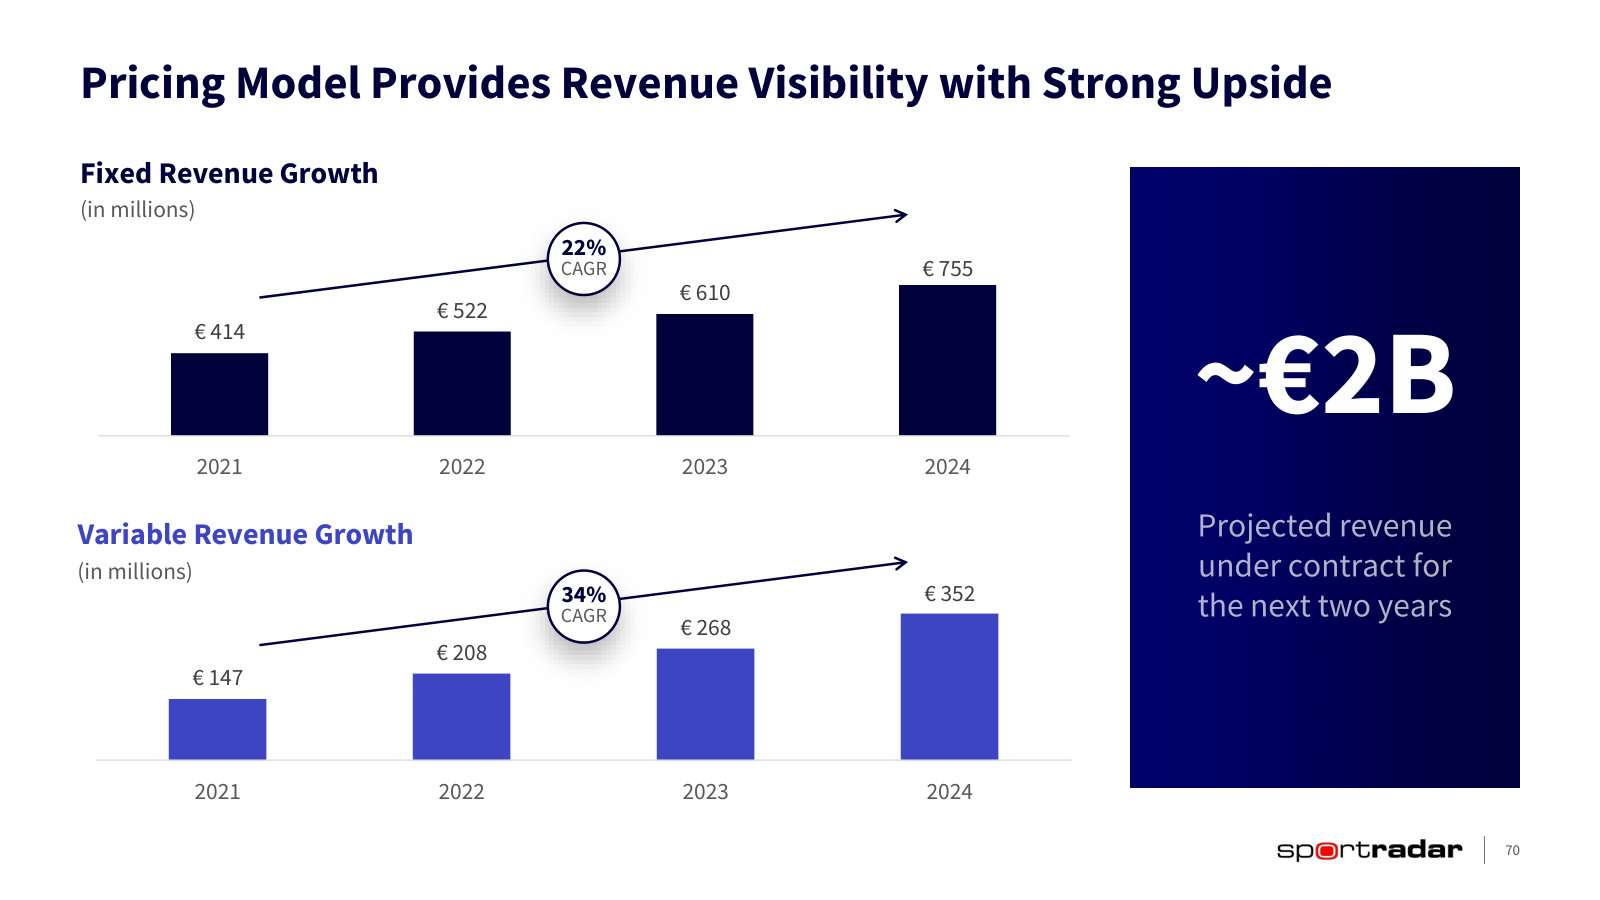
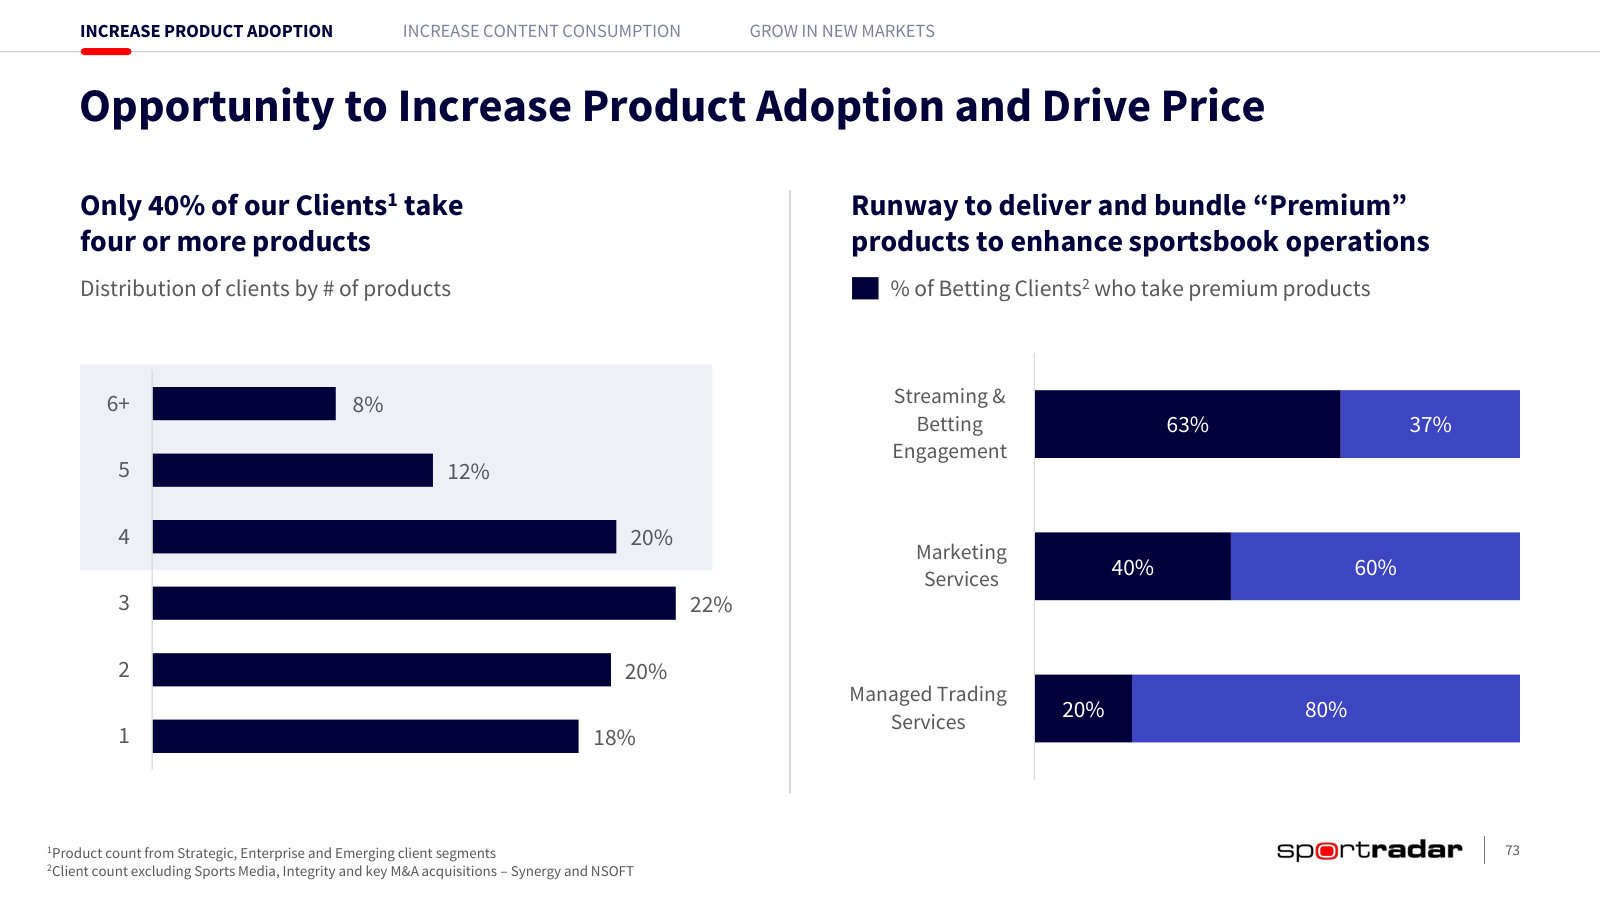
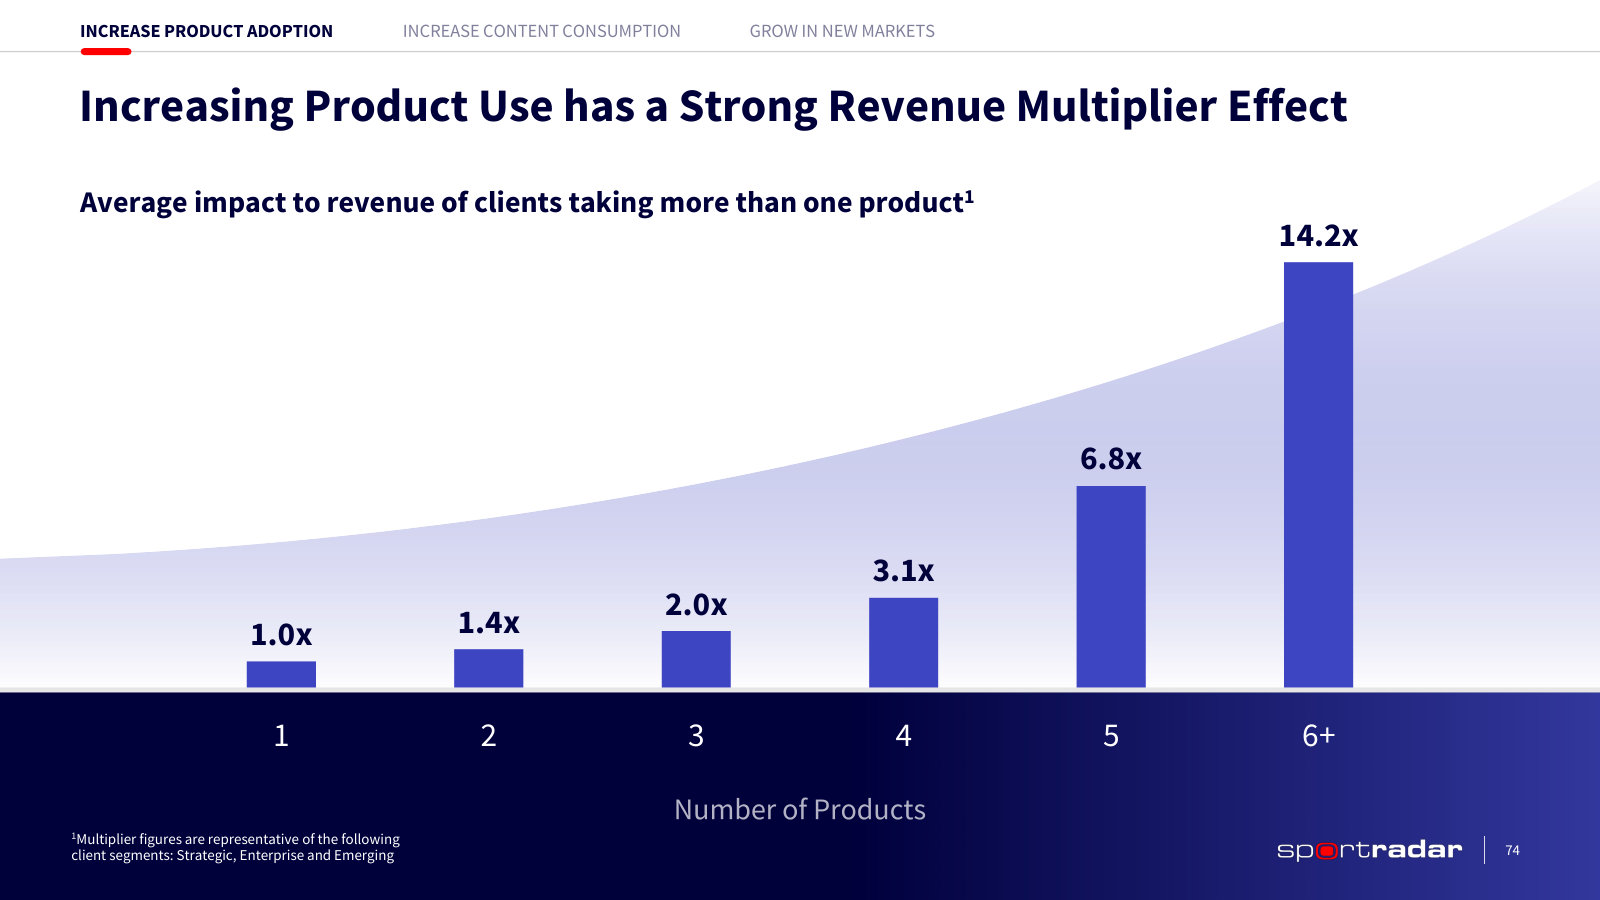
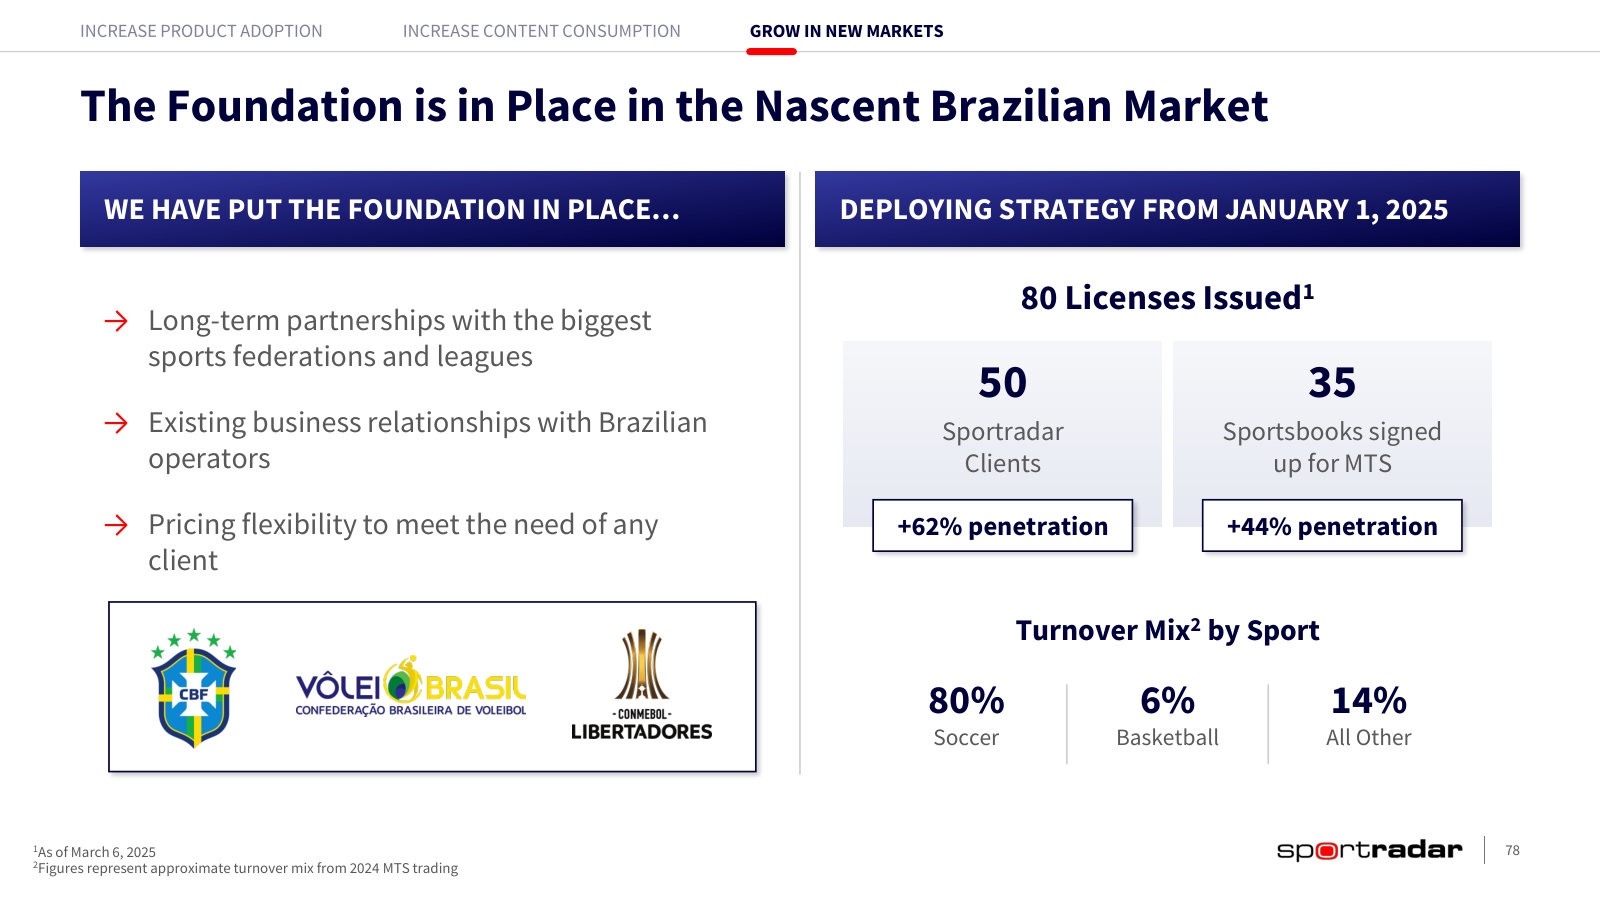
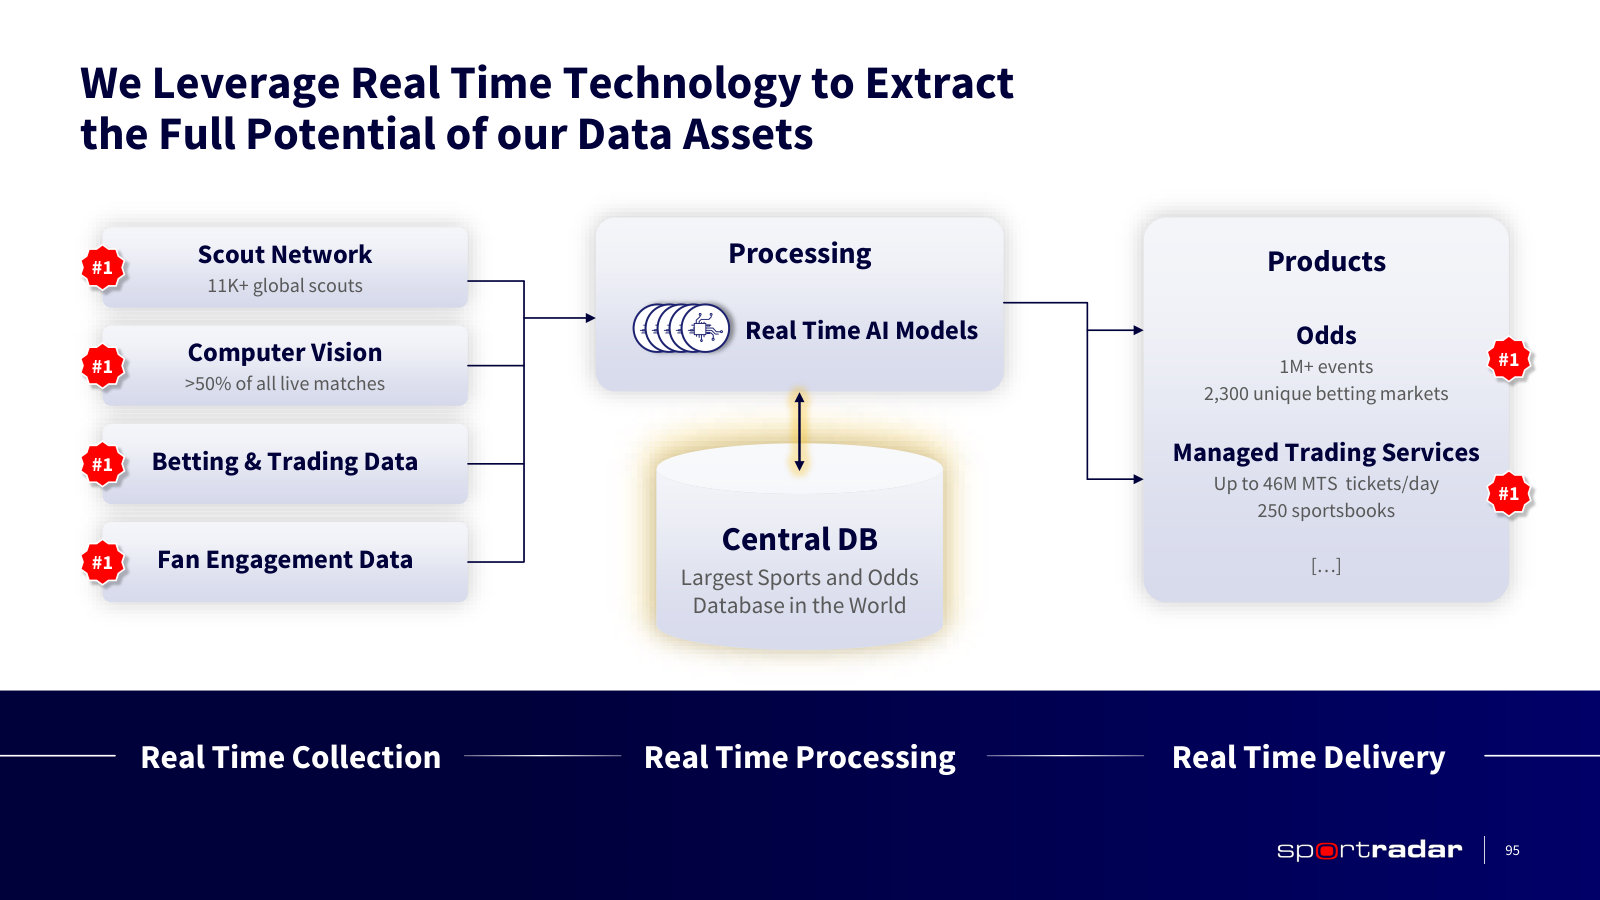
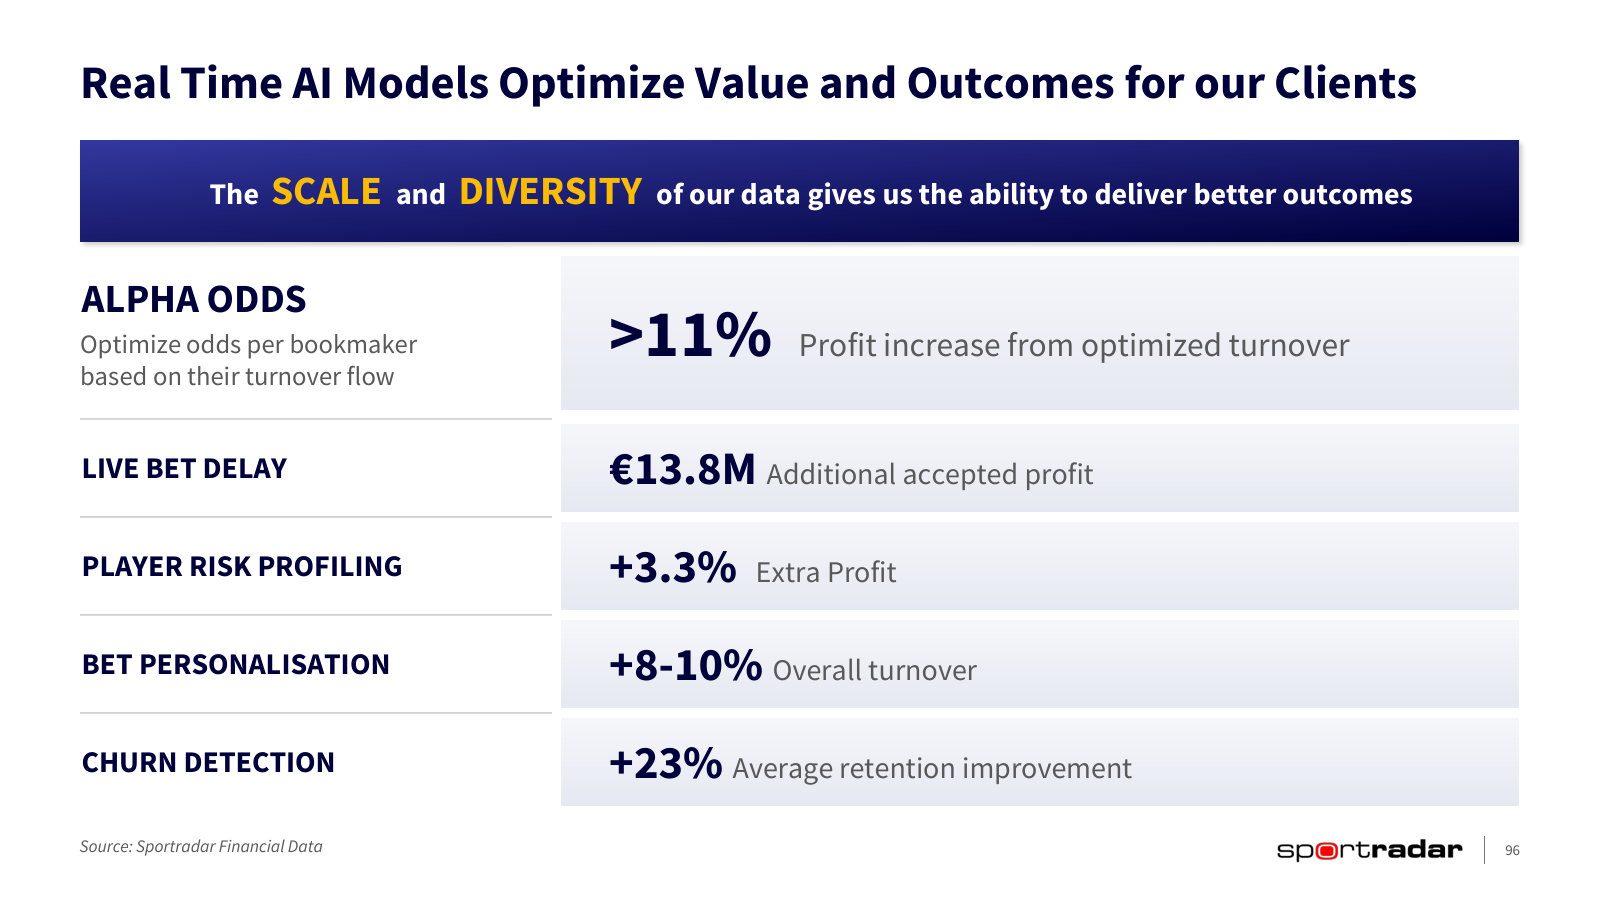
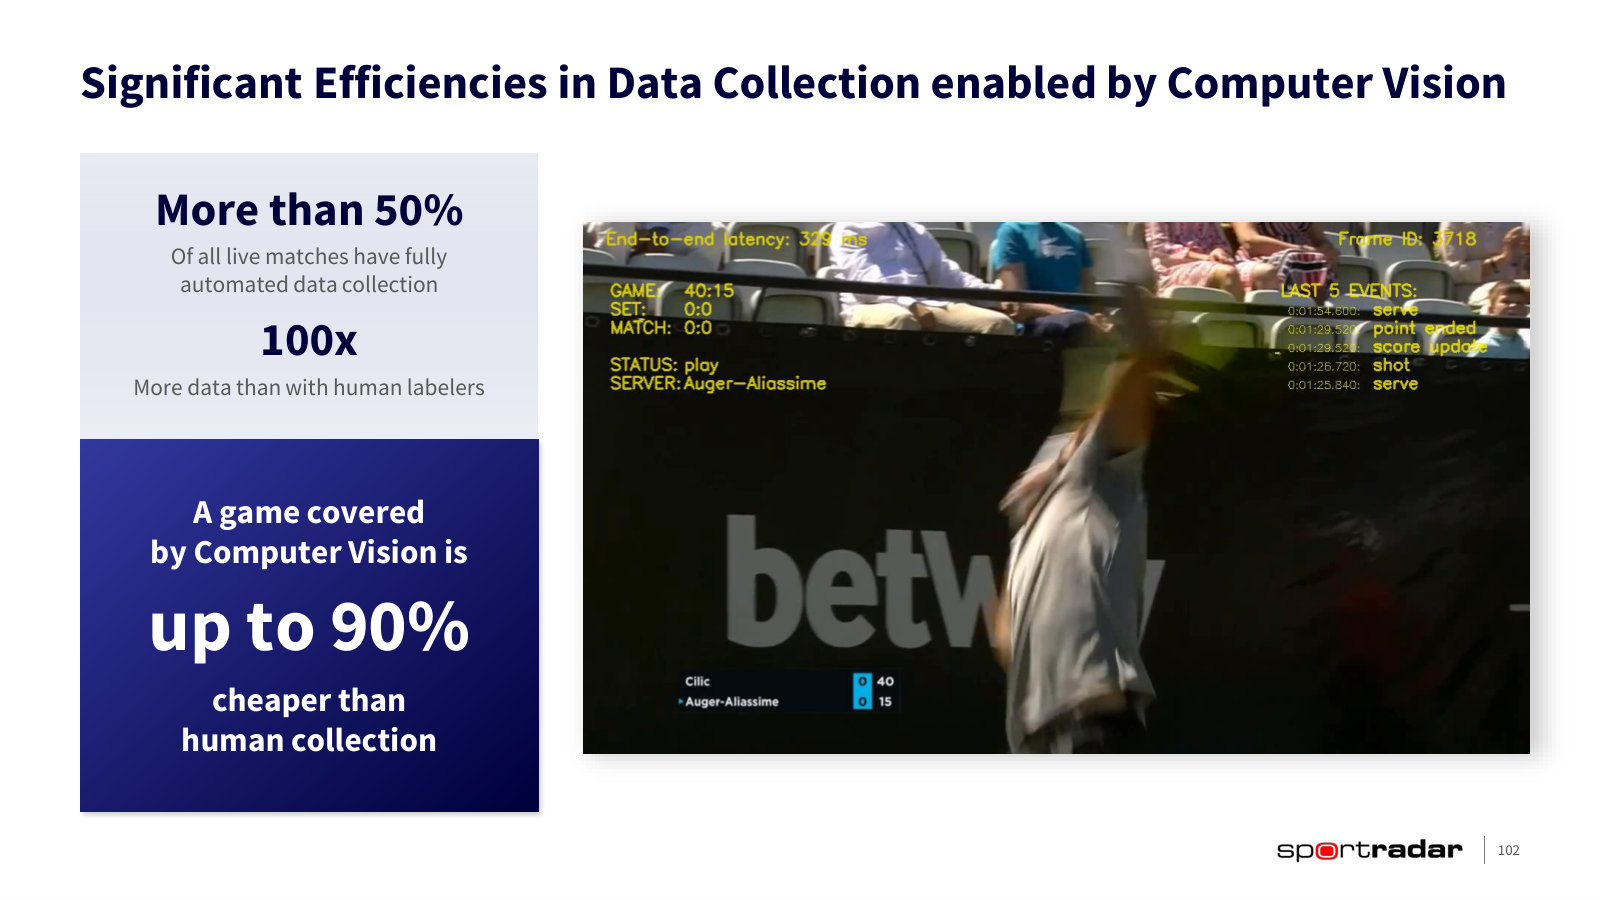
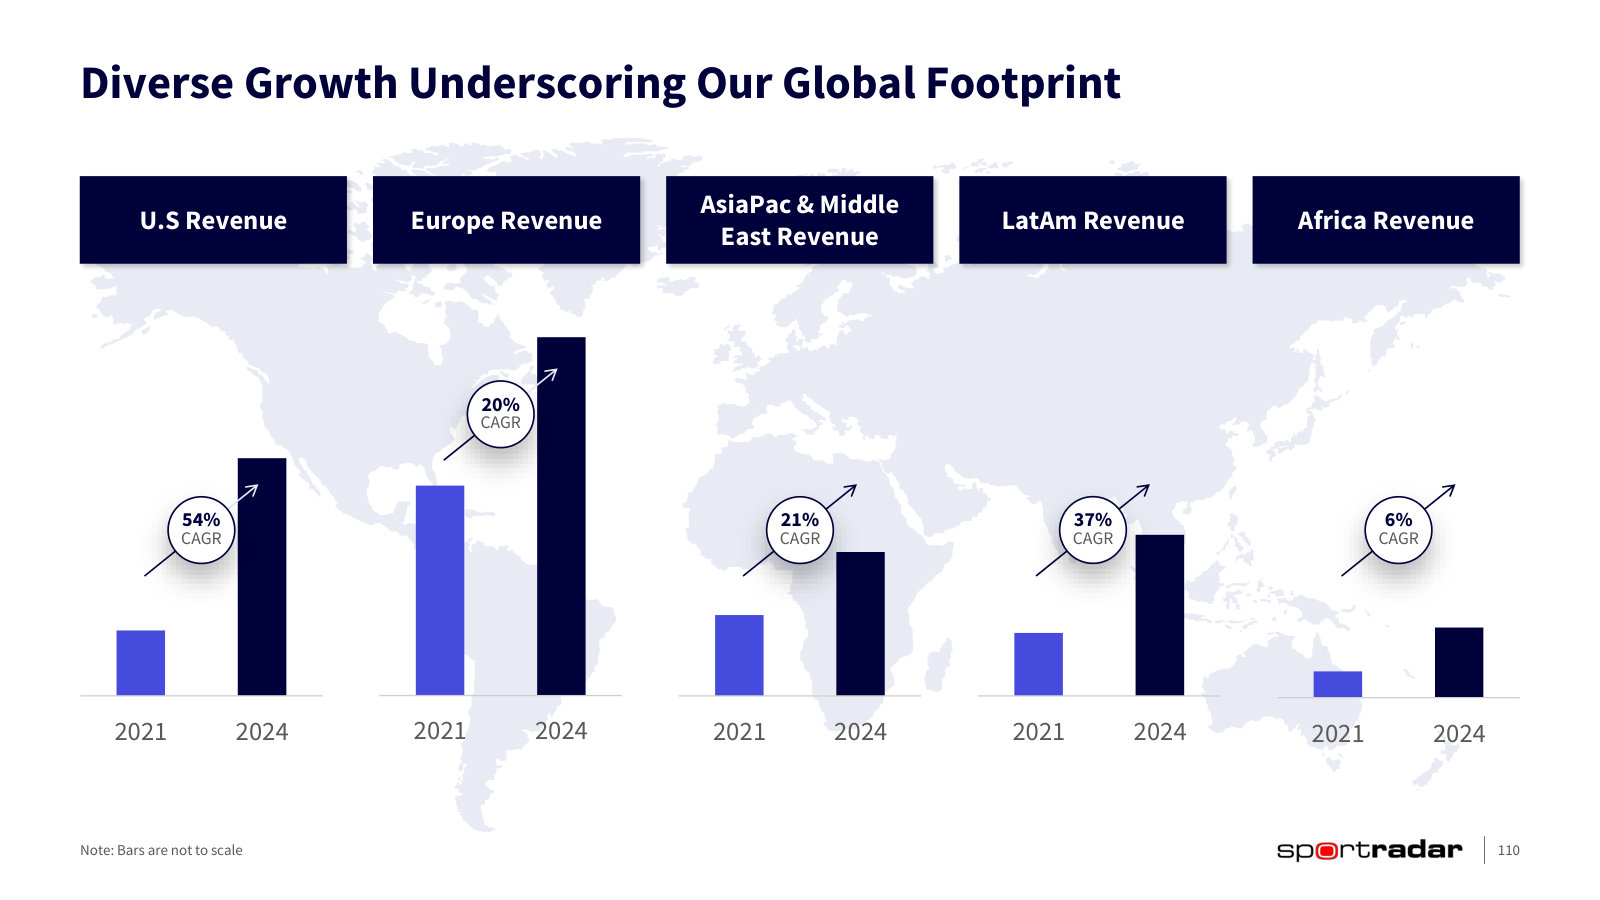
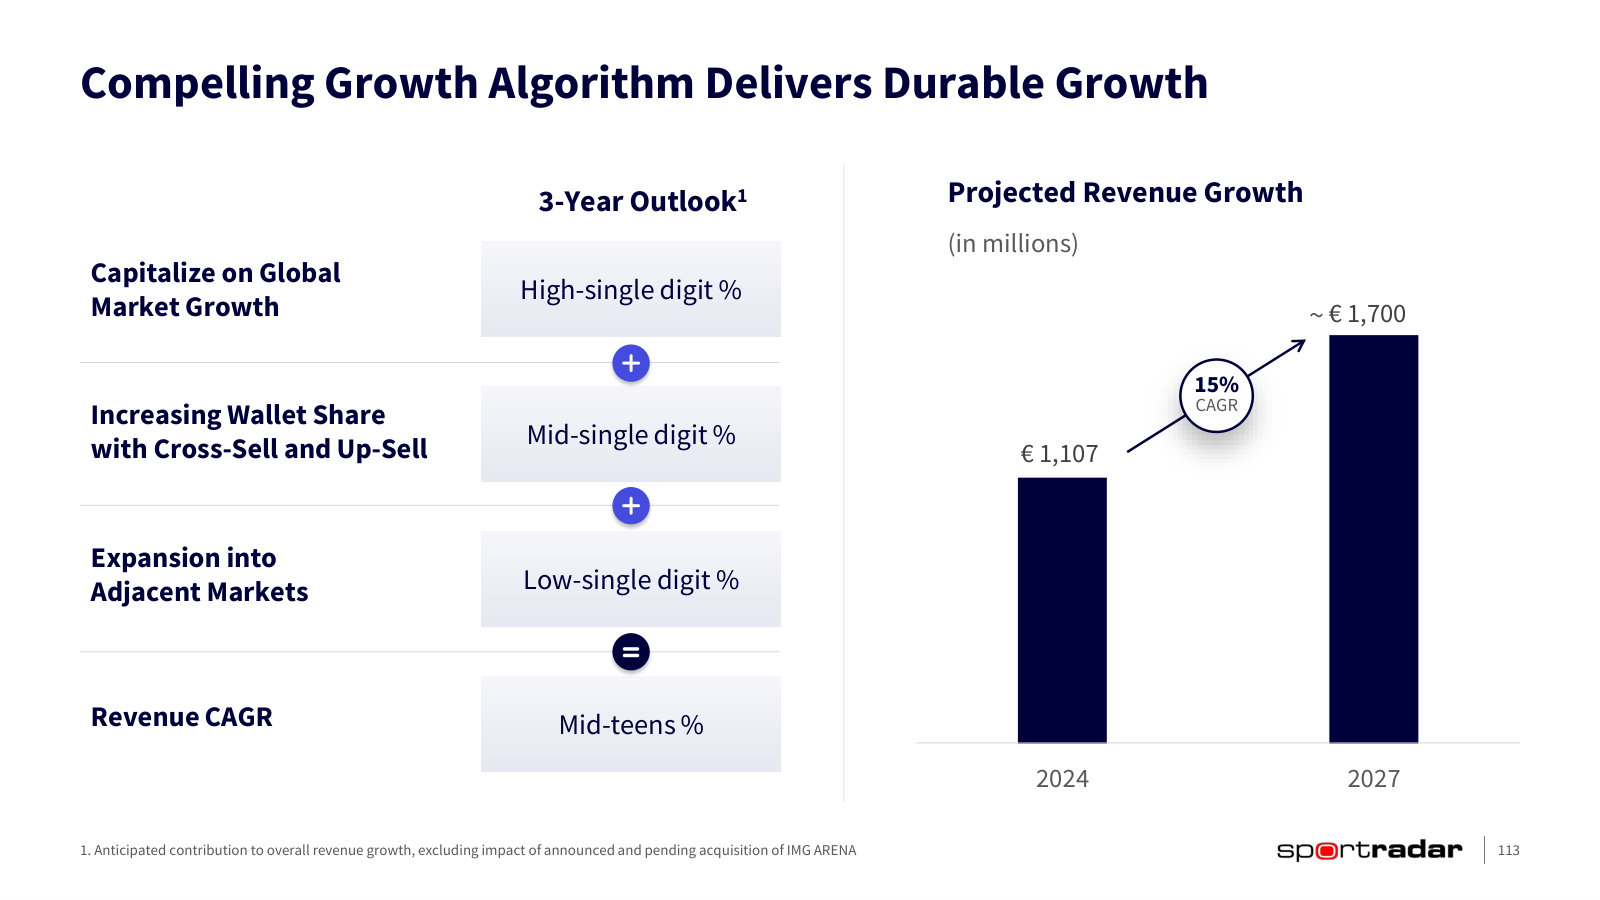
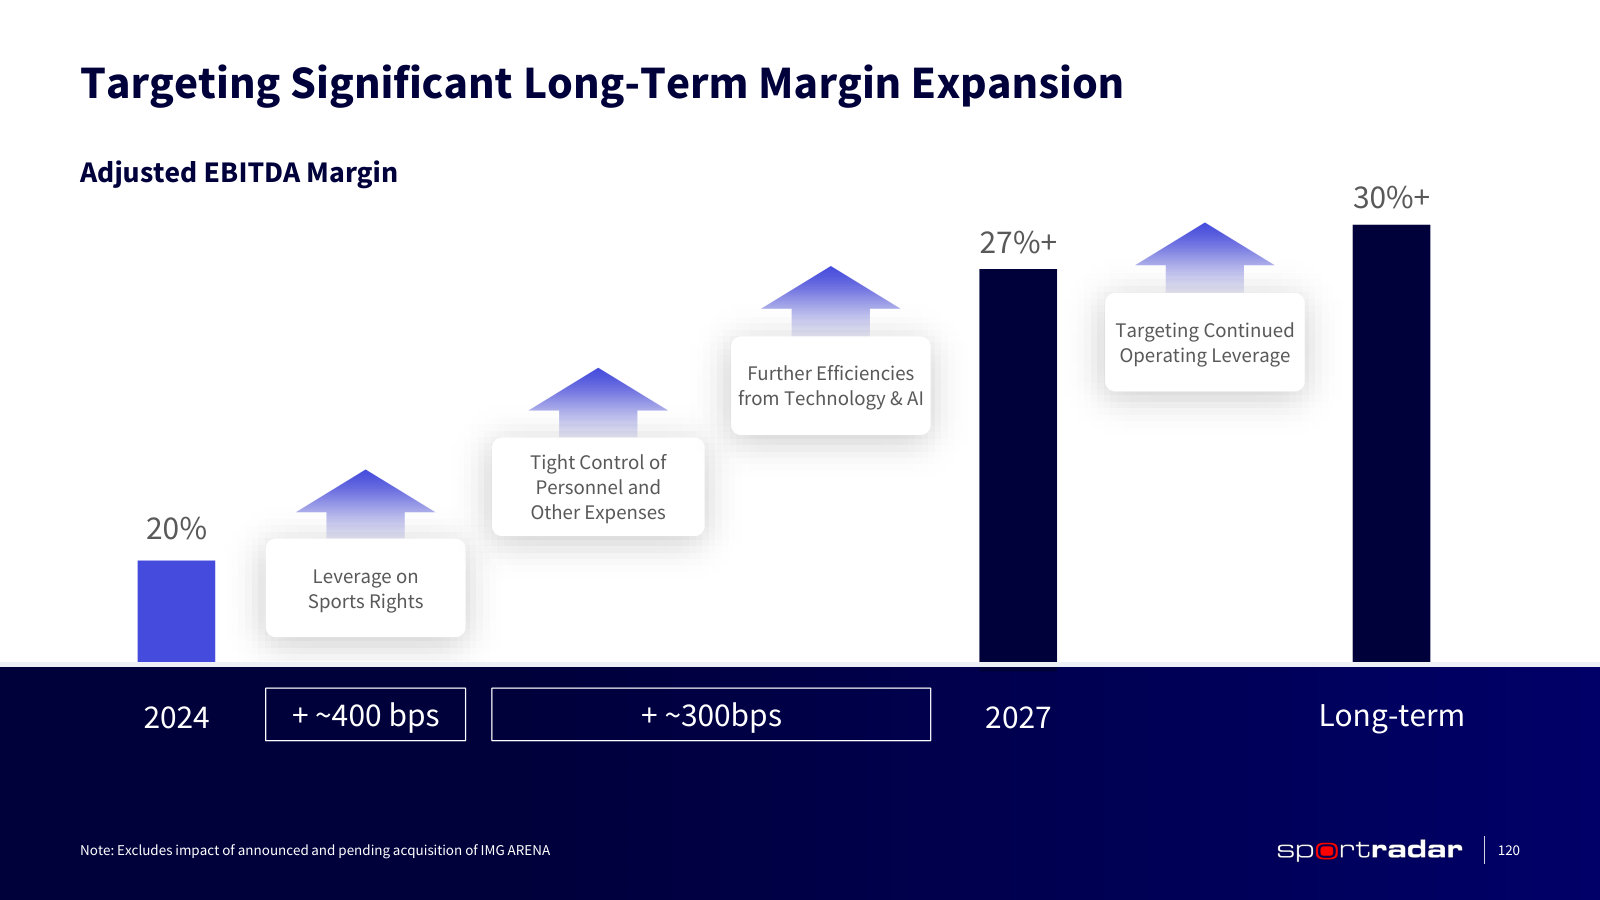
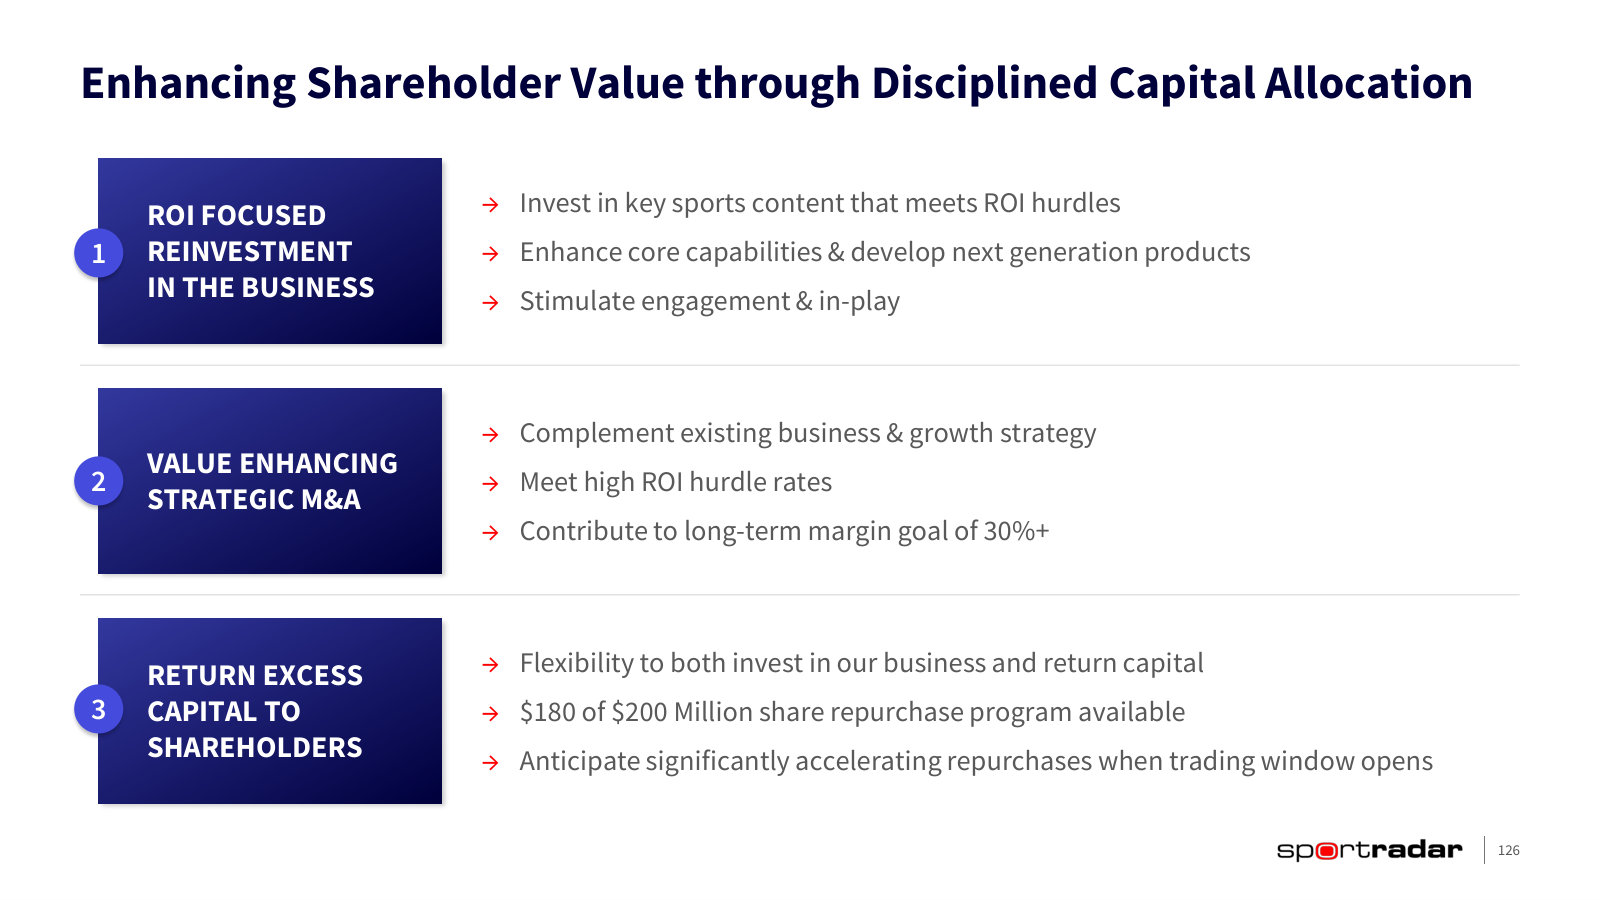
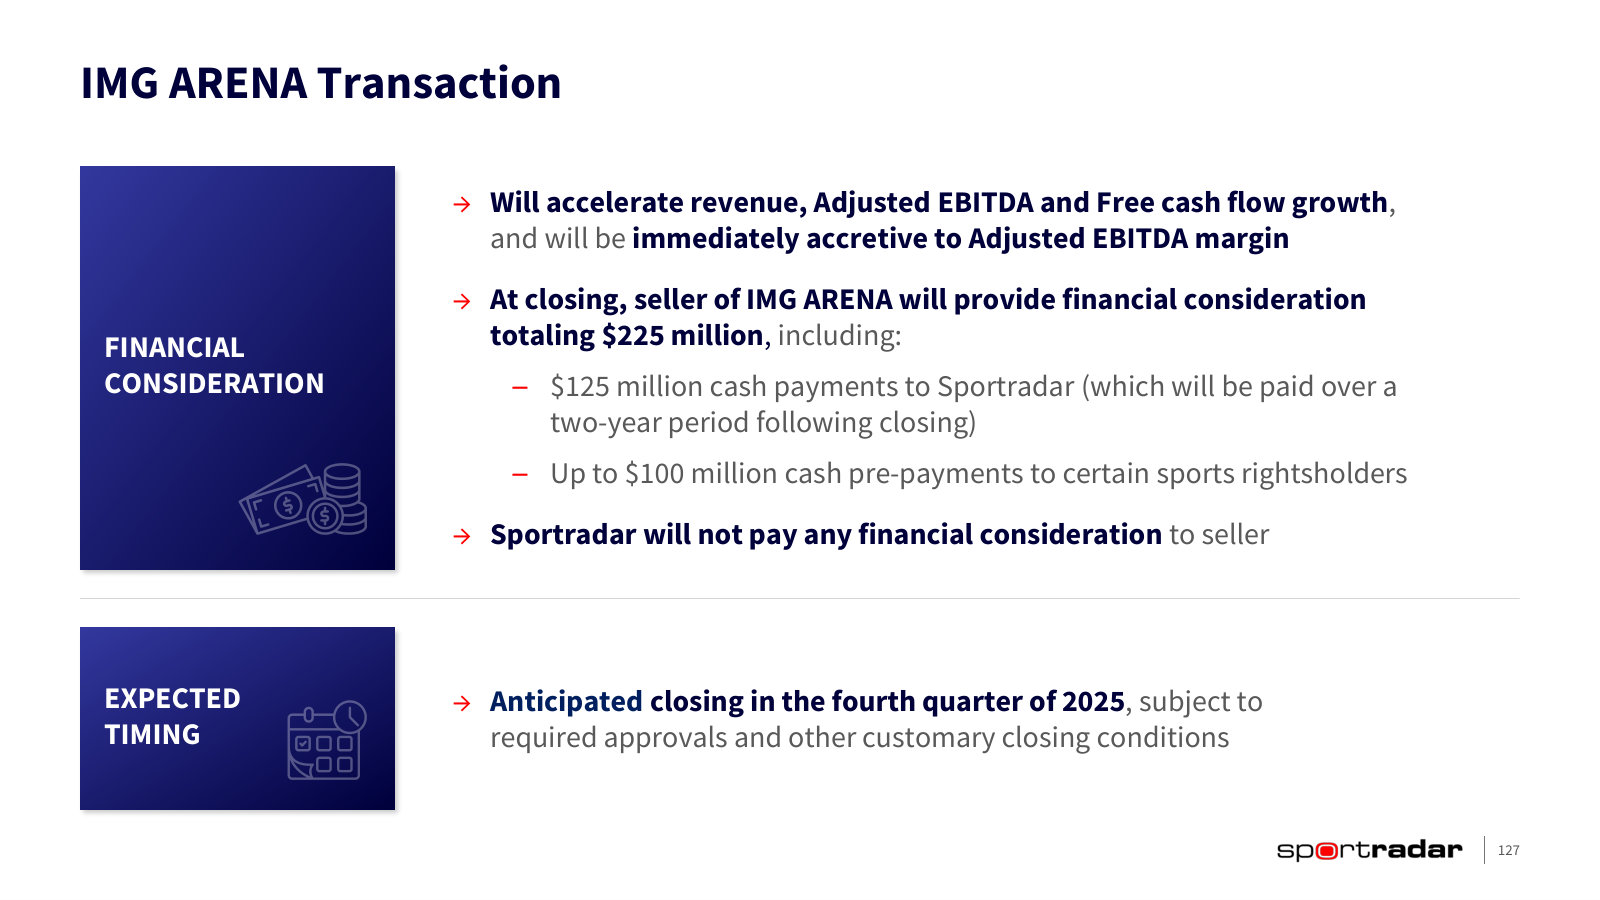
Fourth Quarter & Full Year 2025 Earnings — FY2025
The most recent full-year scorecard: 2025 results, the first real read on IMG ARENA after closing, and 2026 guidance. · Open the full document →
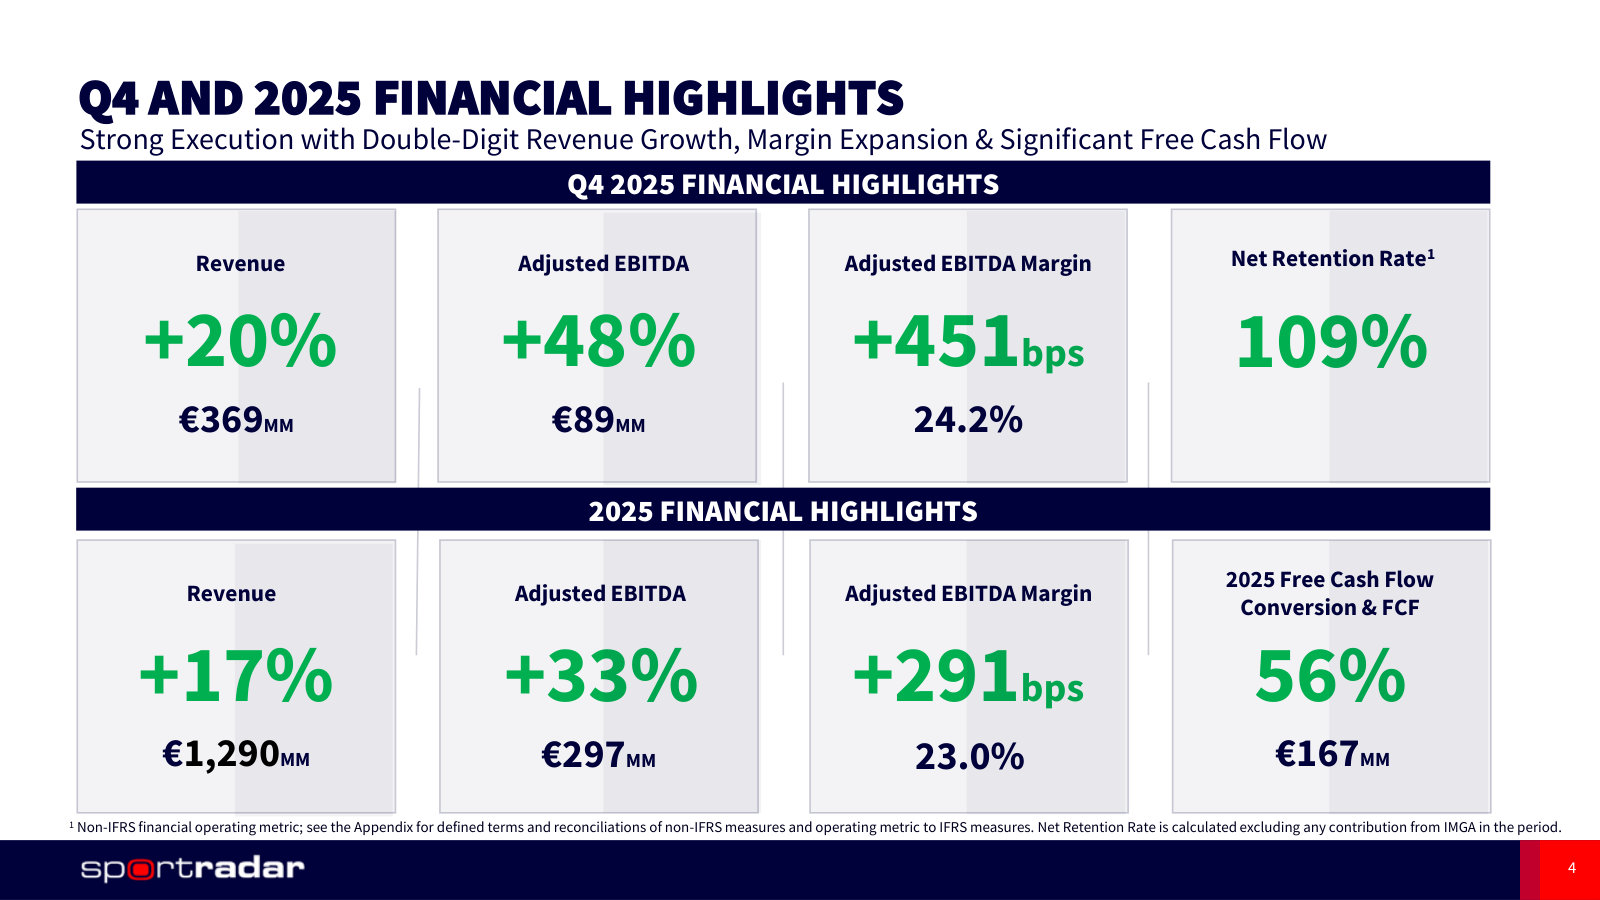
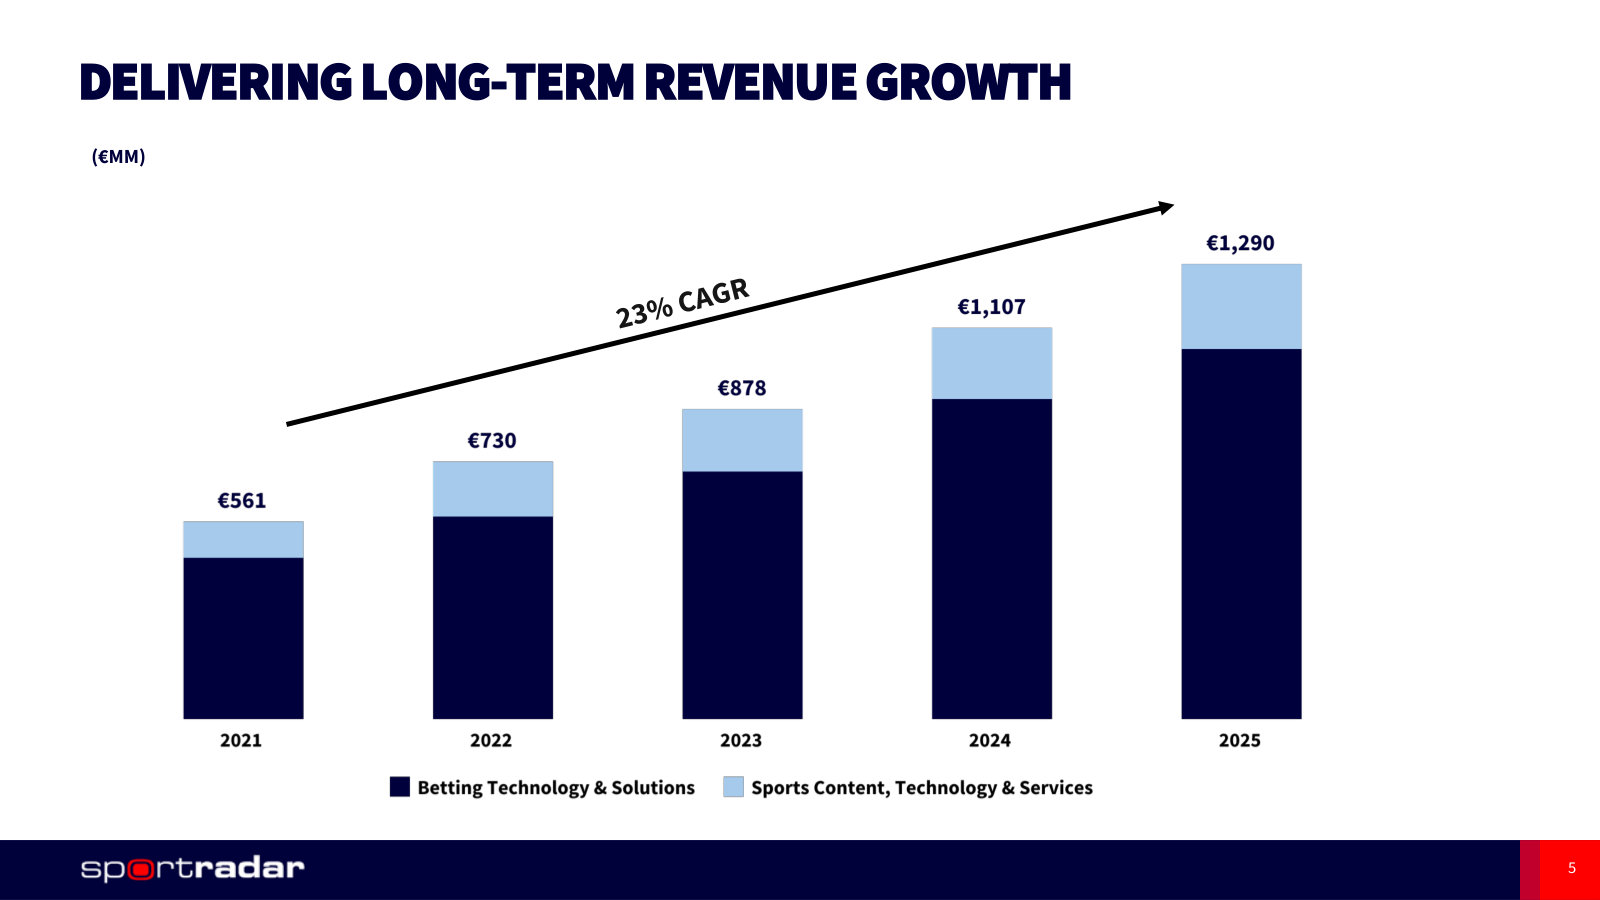
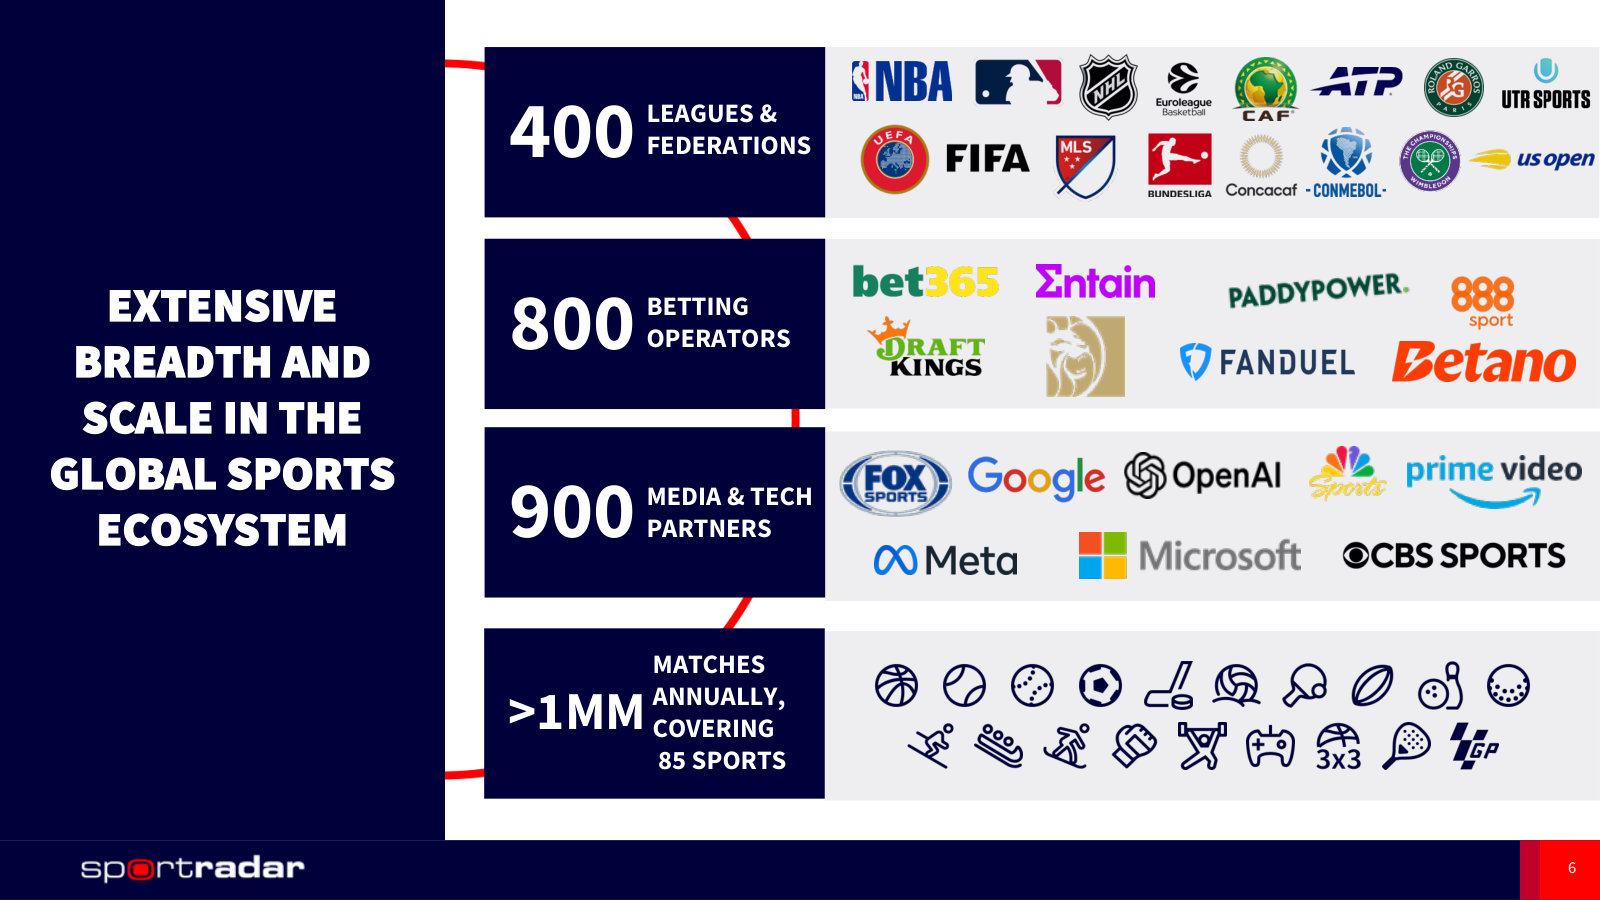
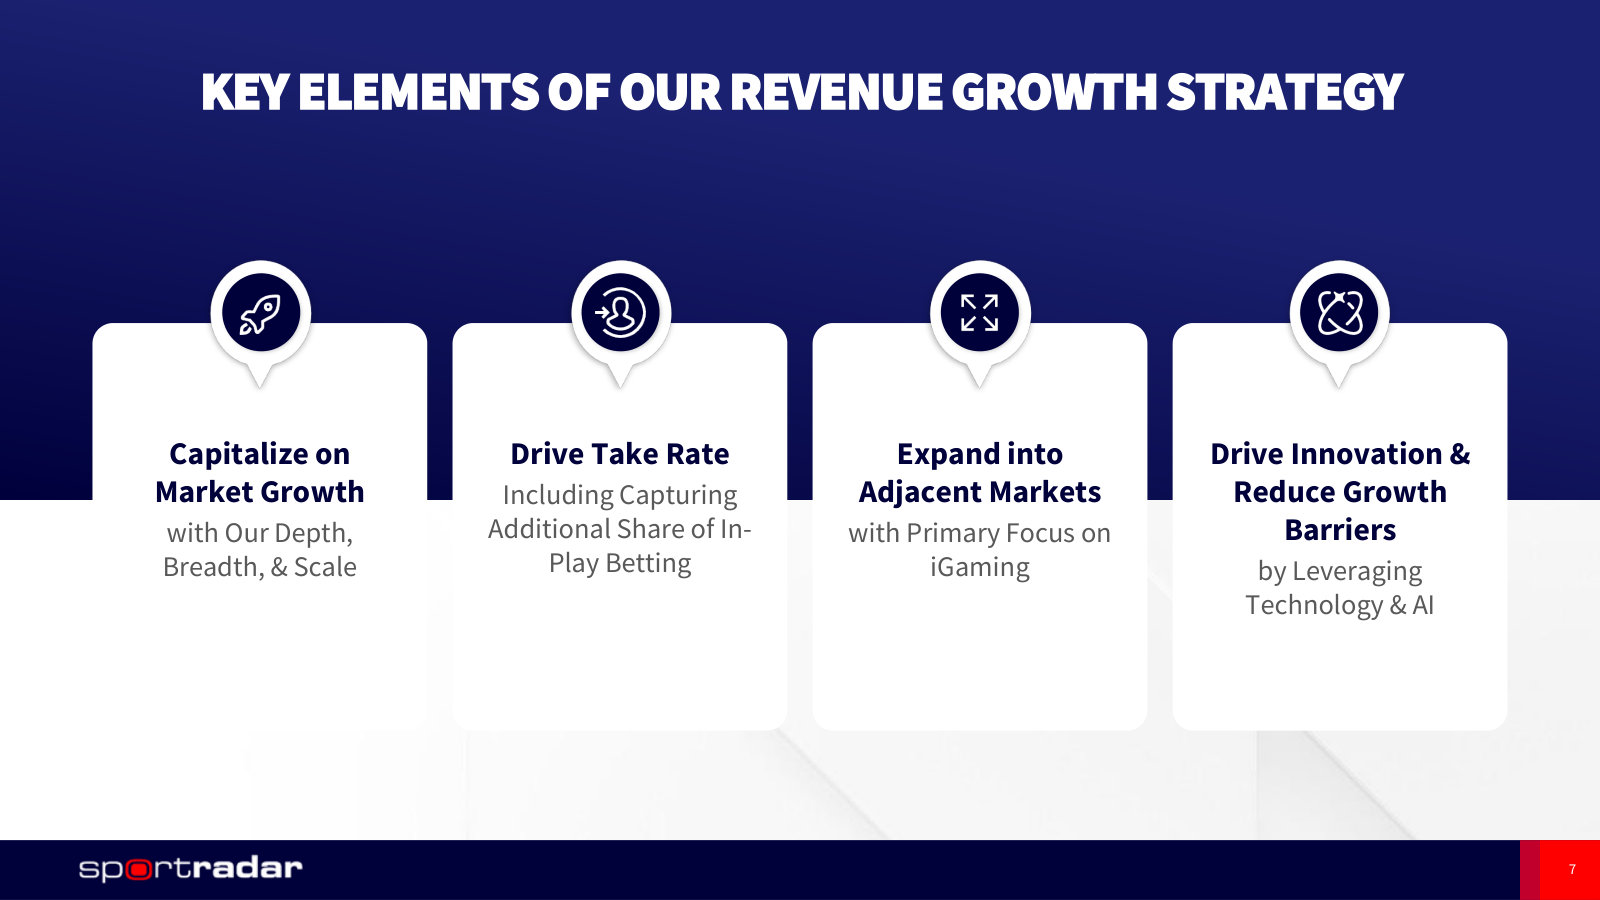
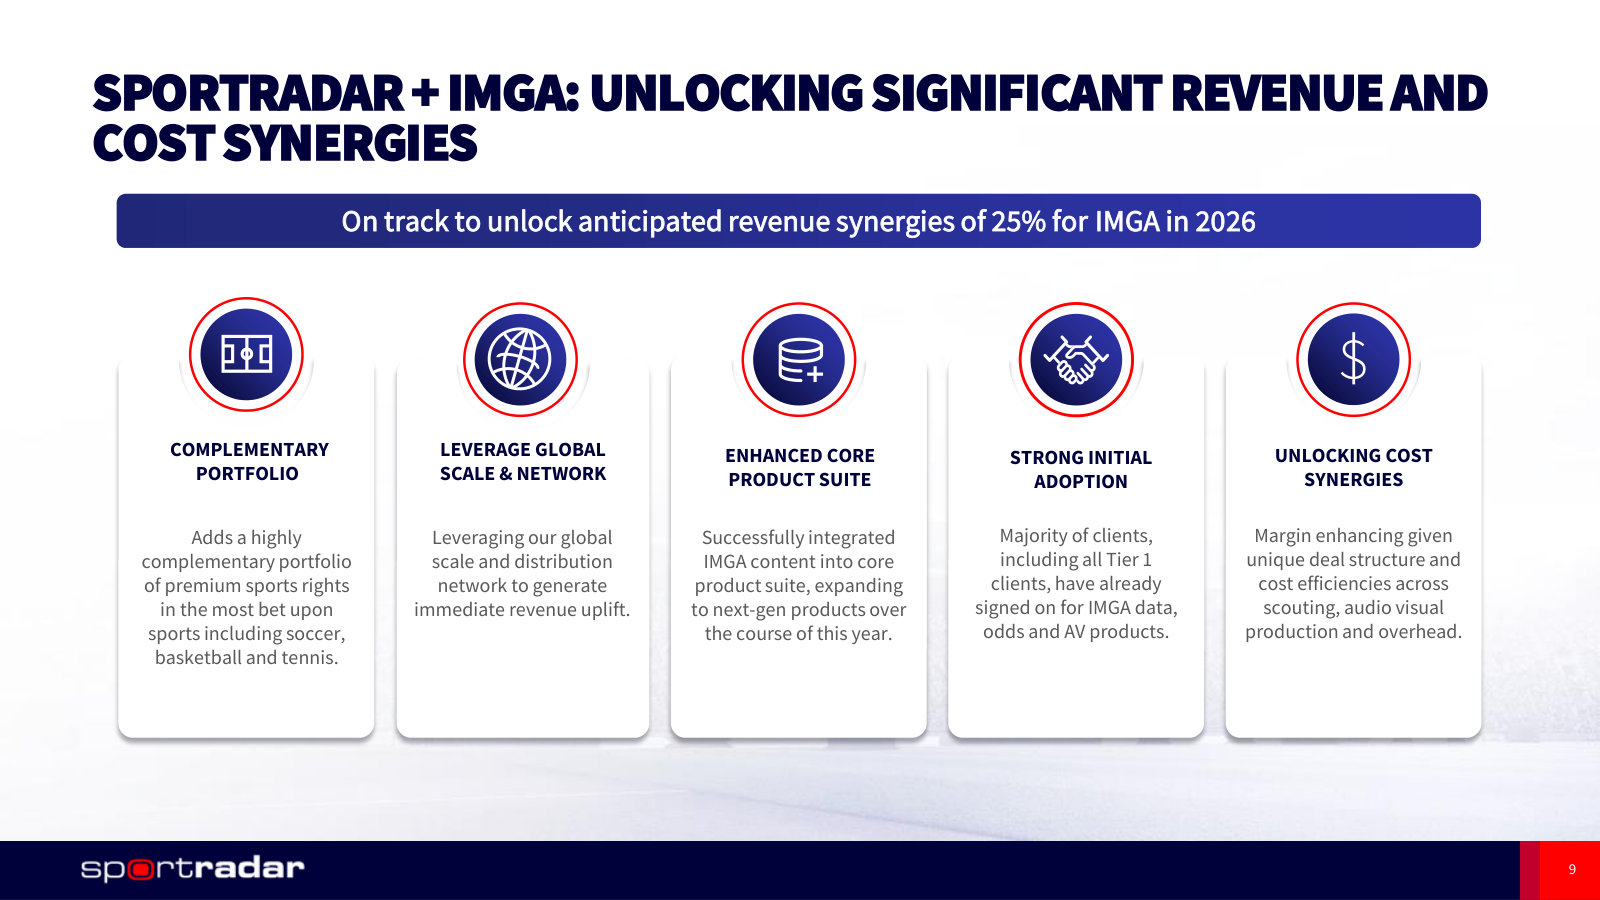
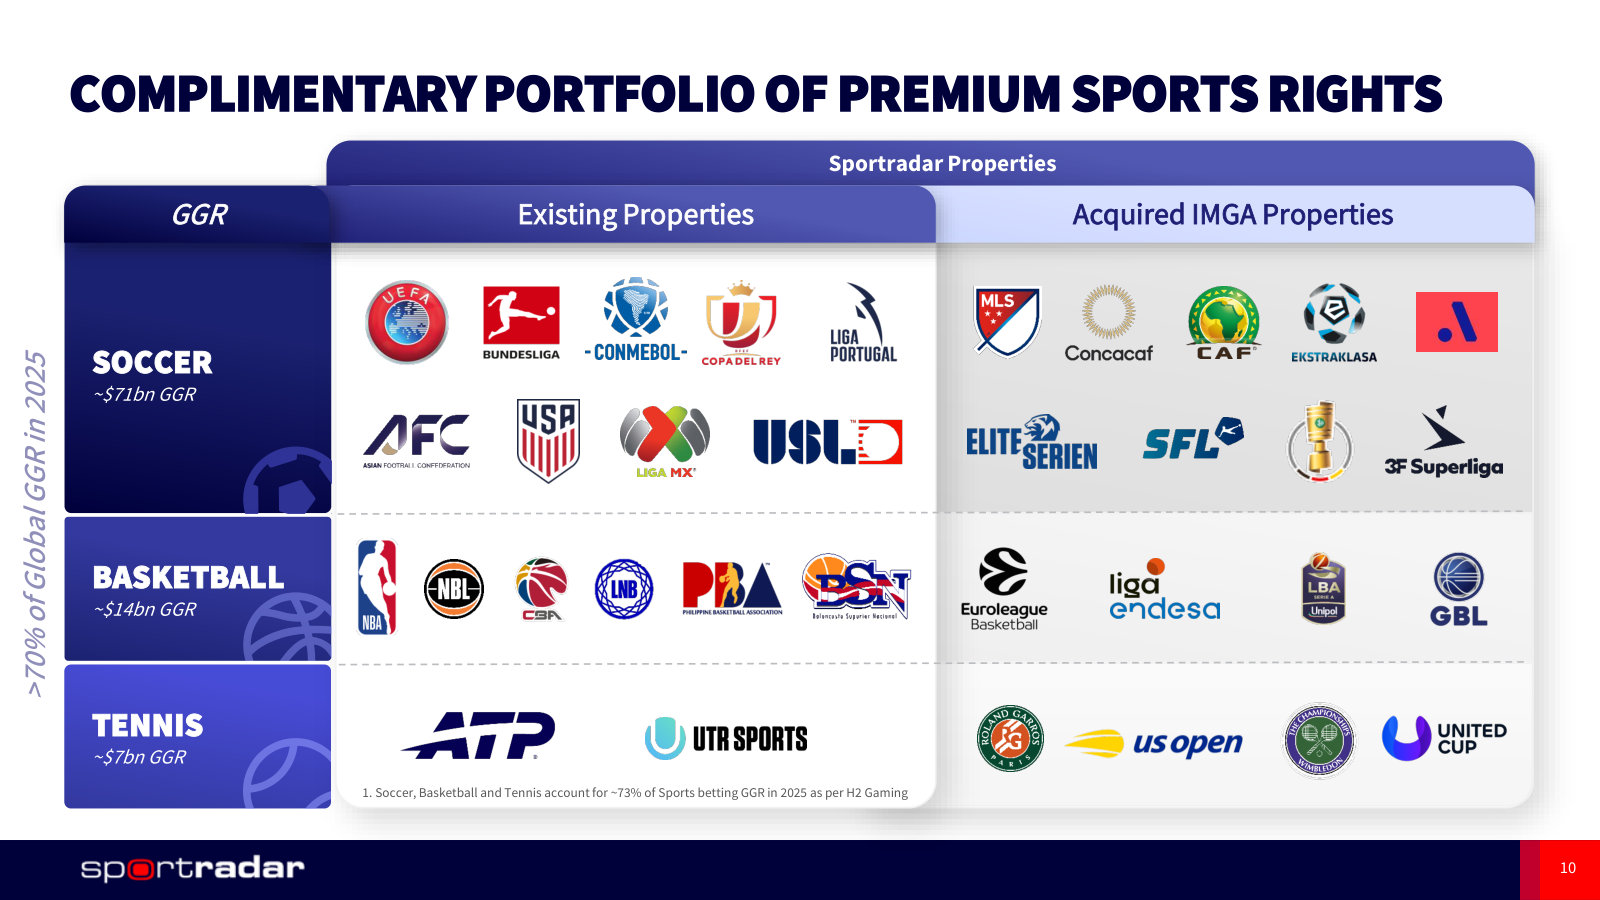
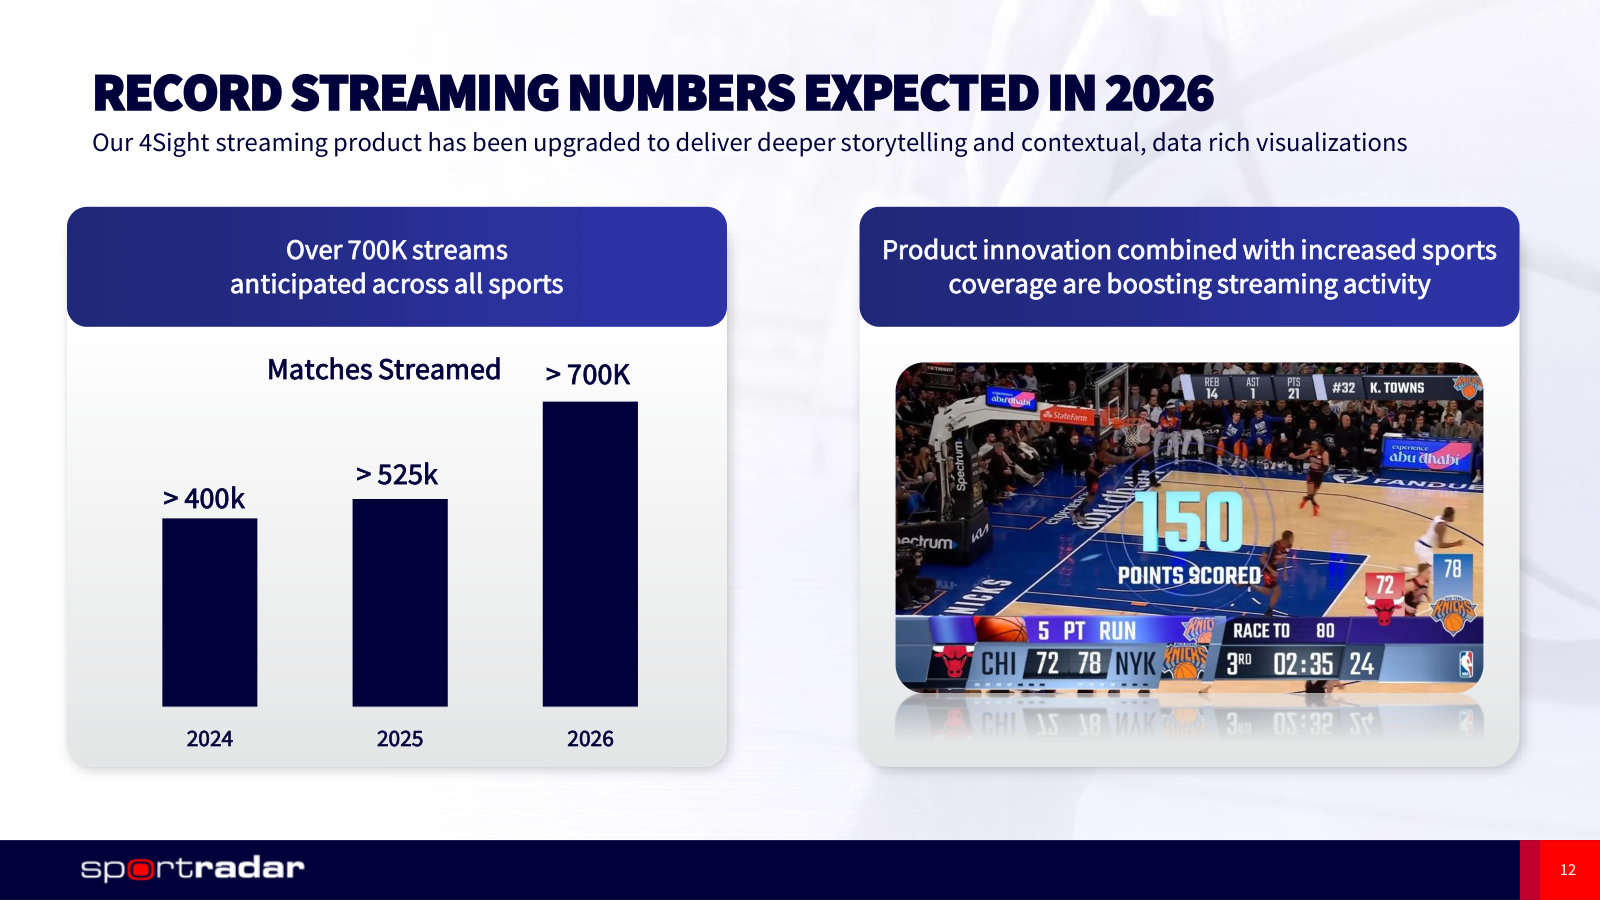
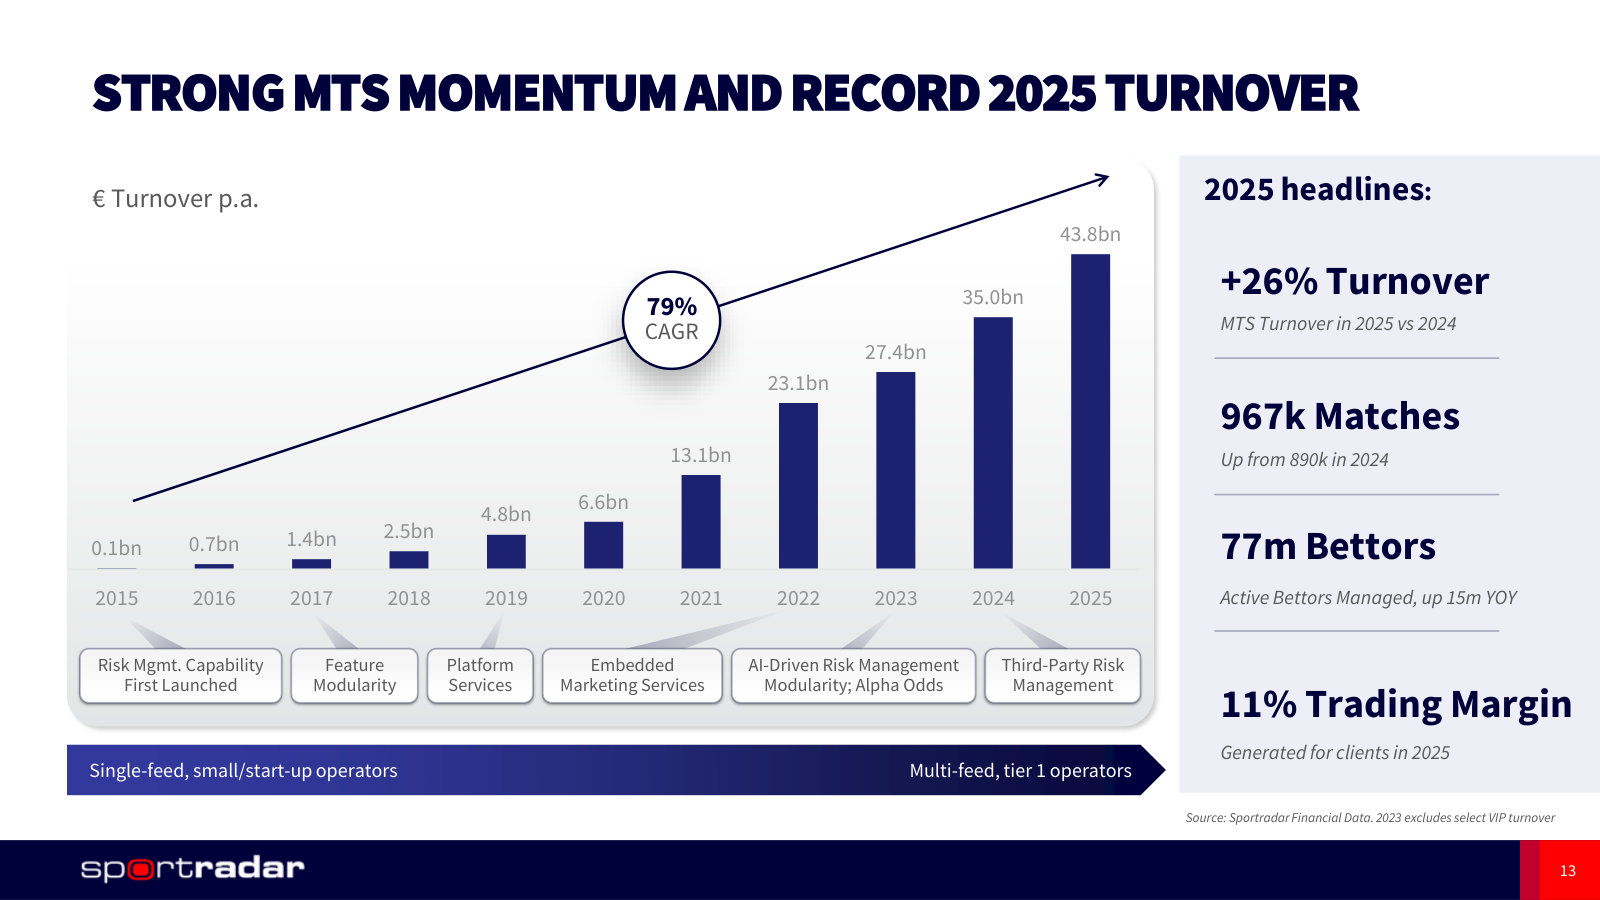
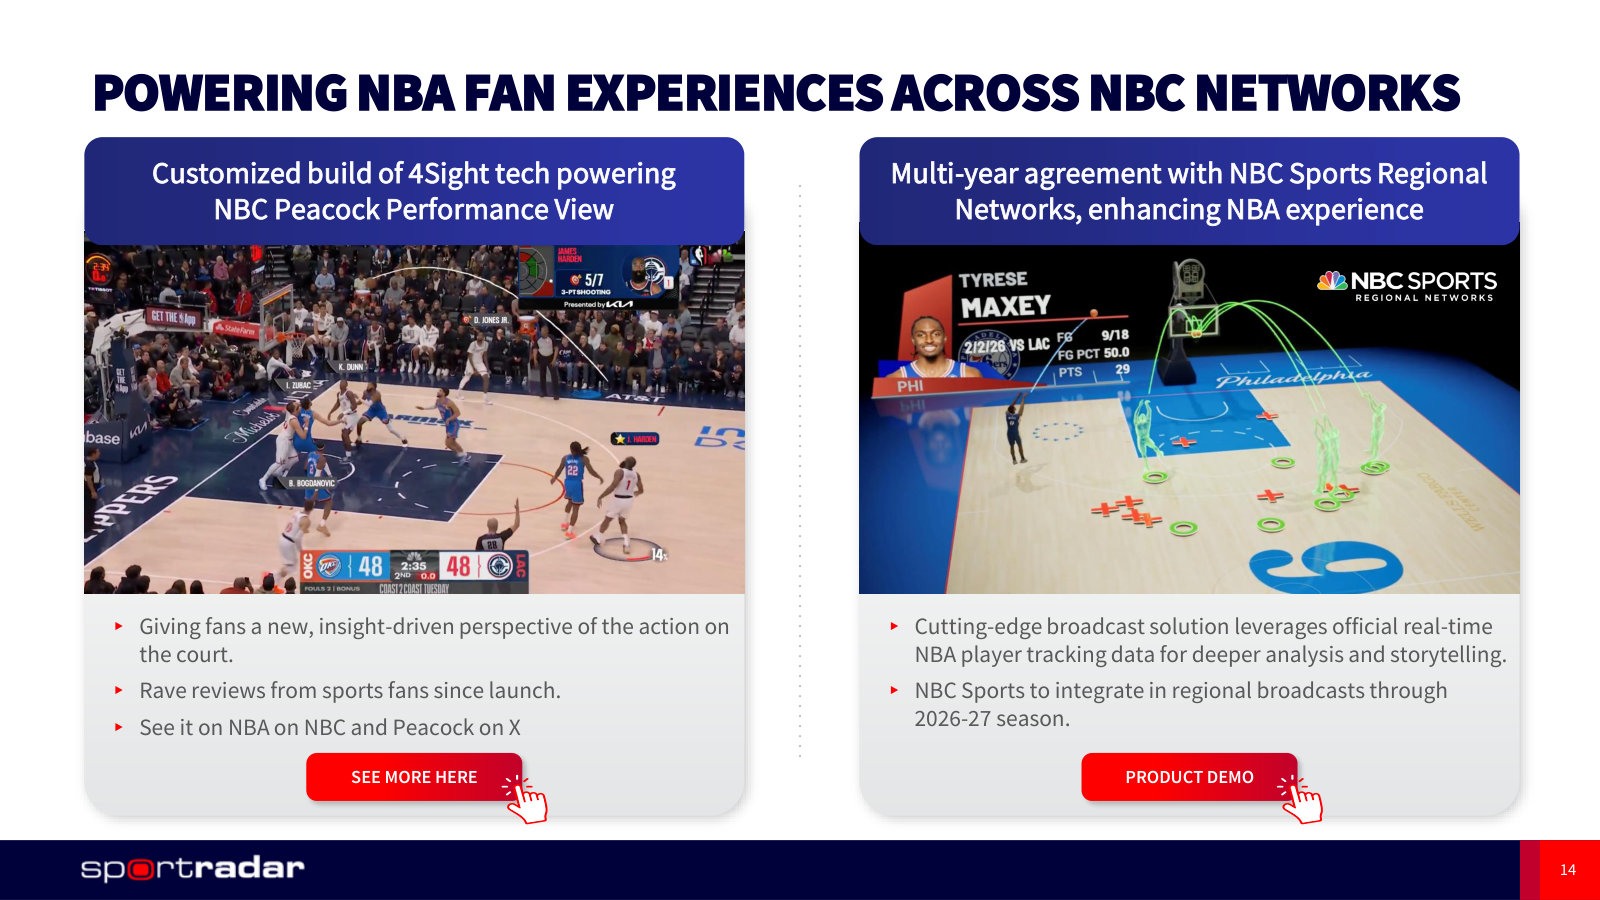
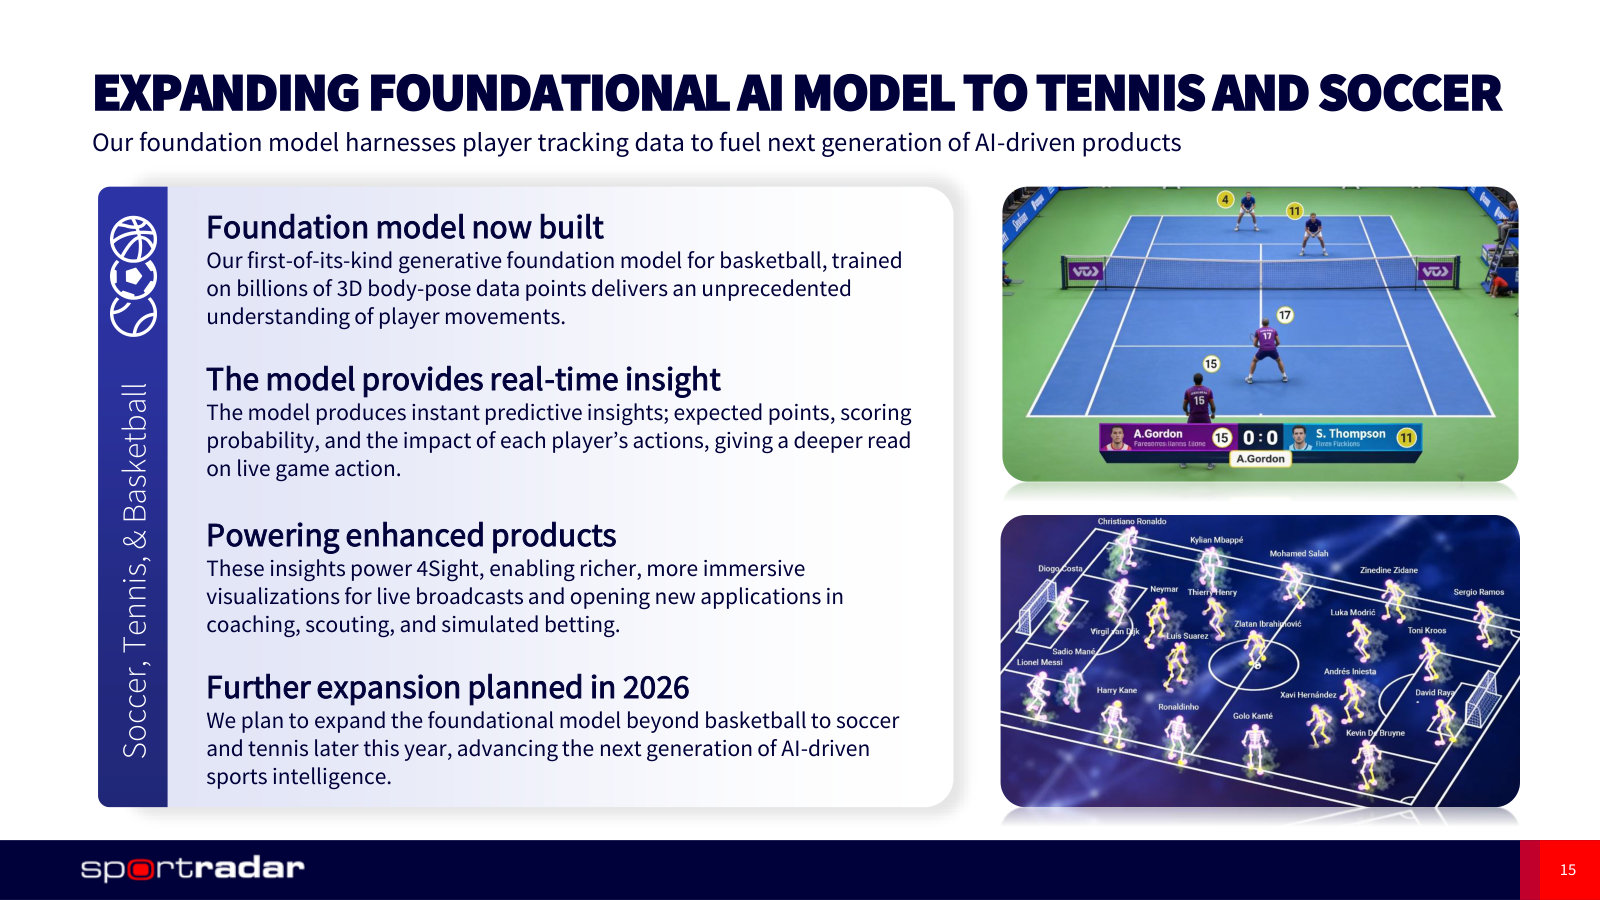
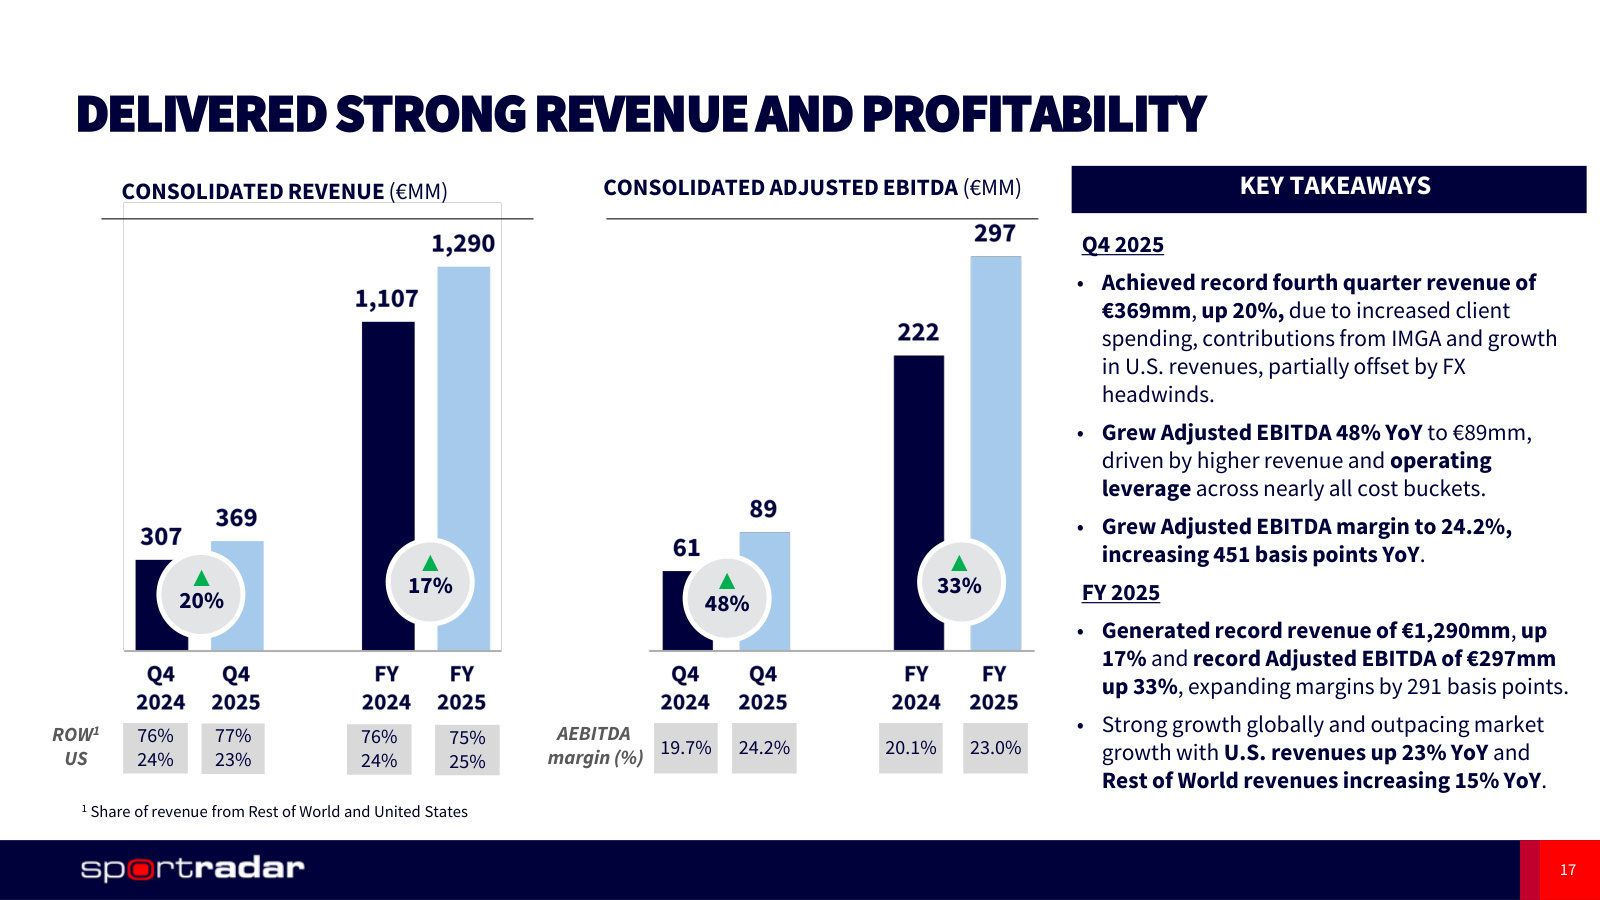
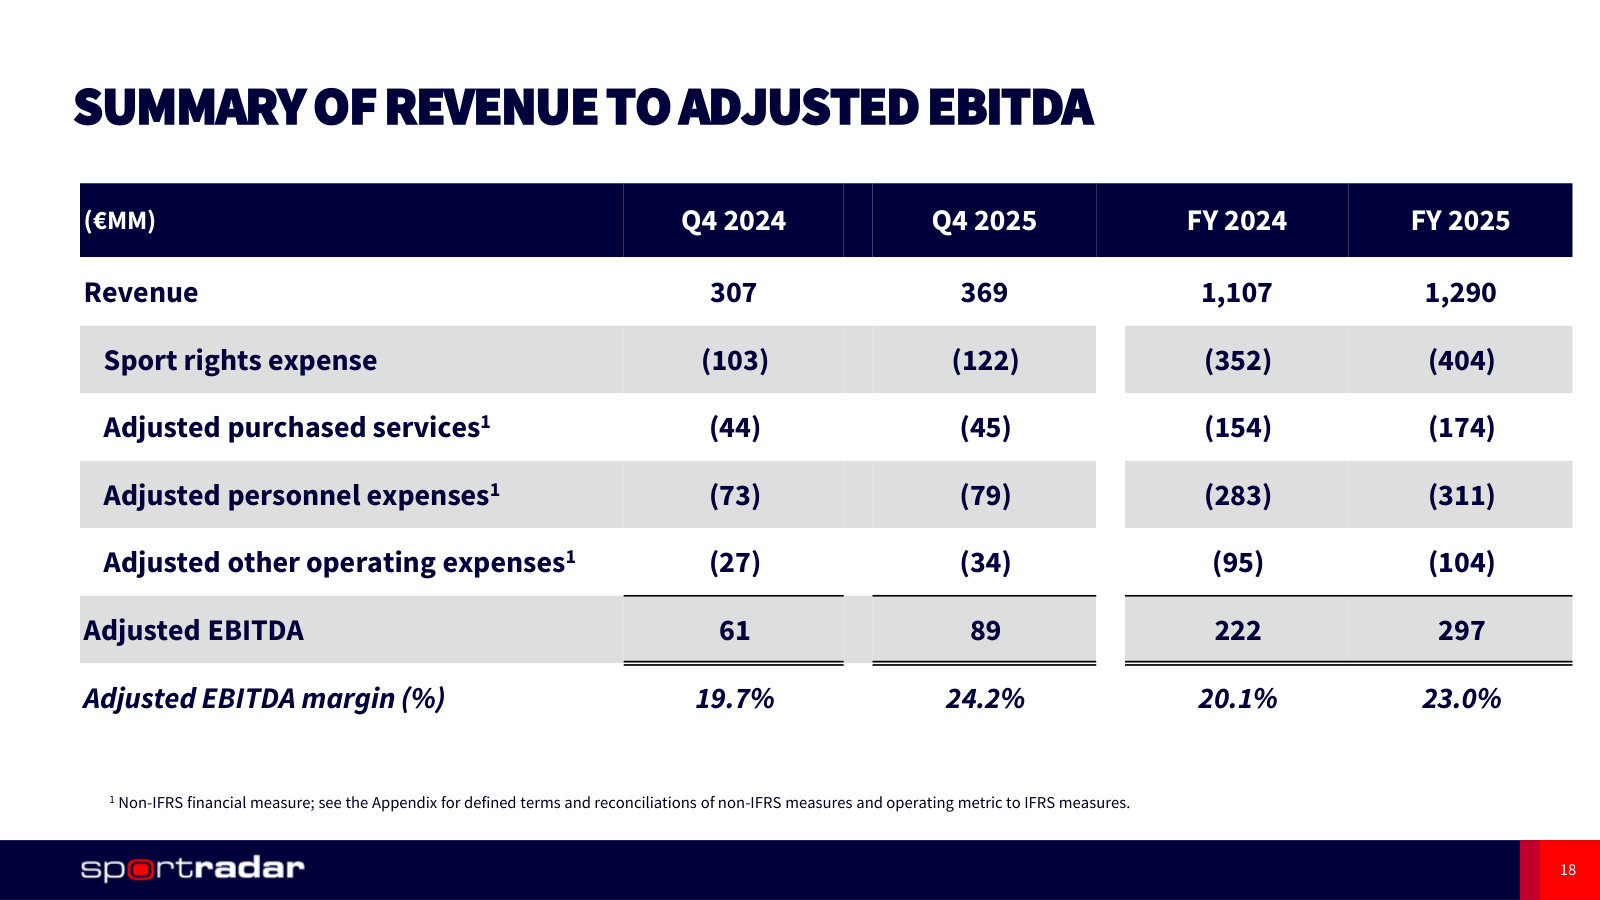
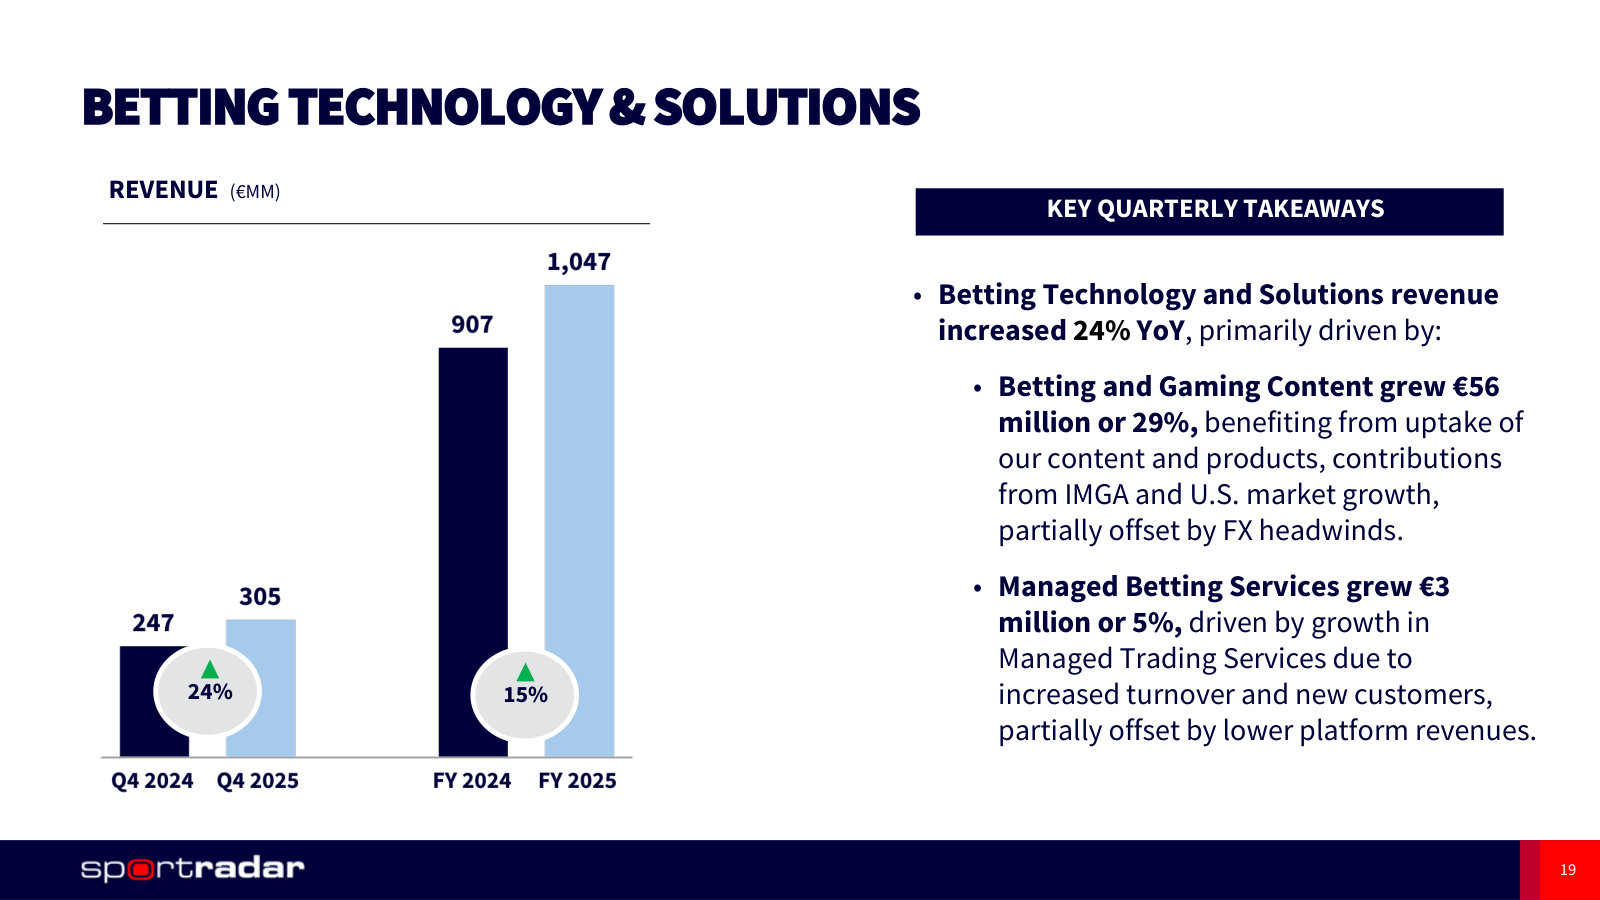
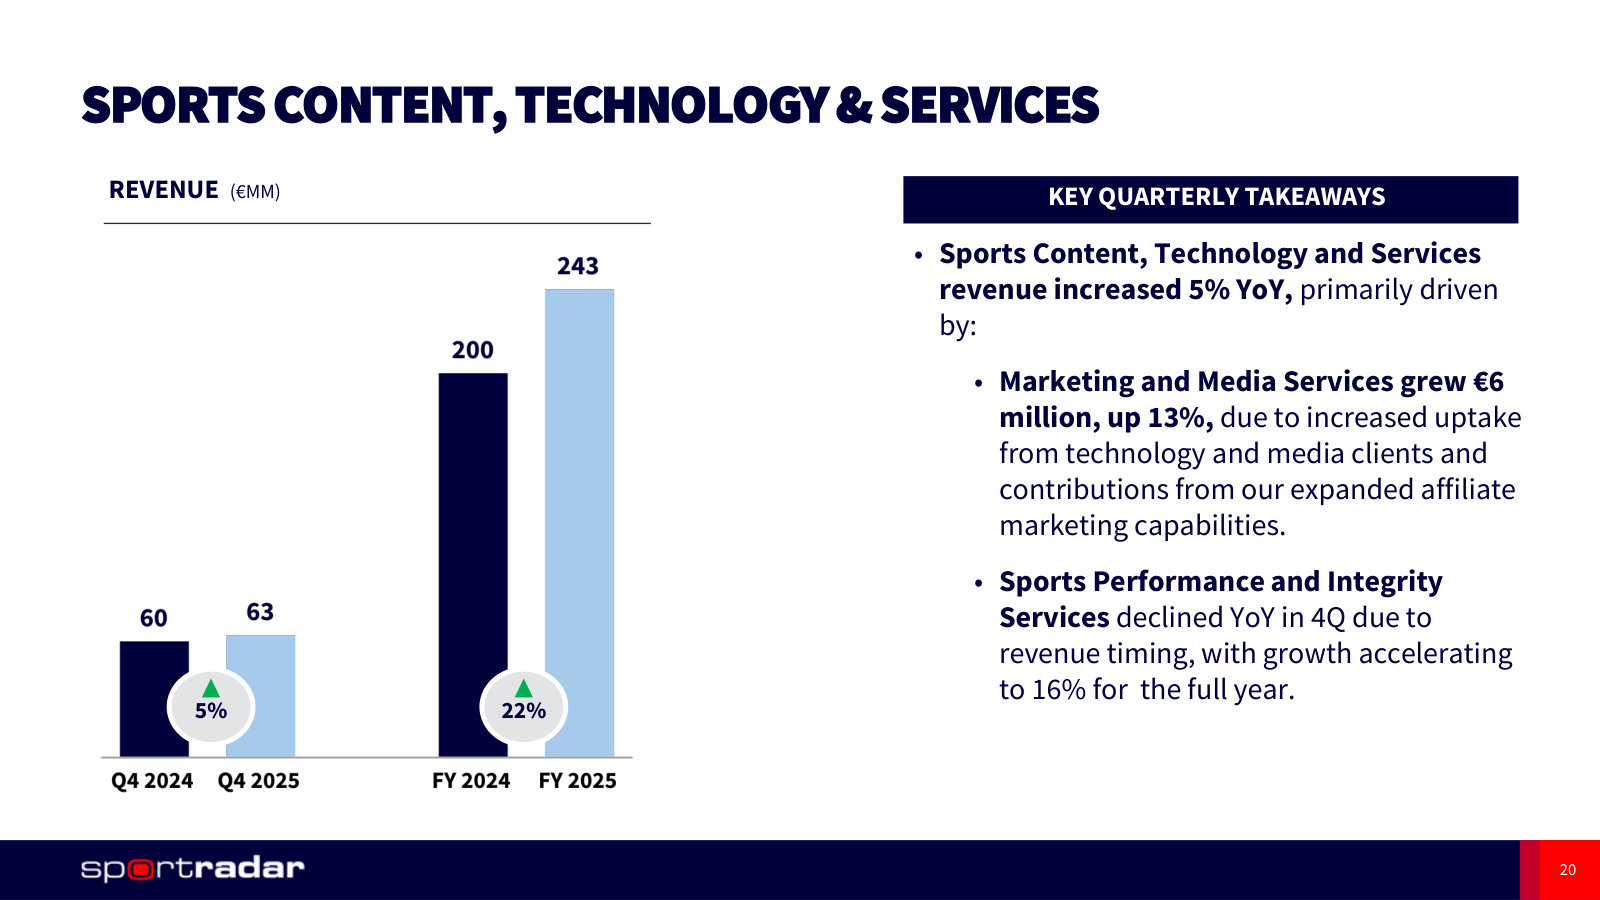
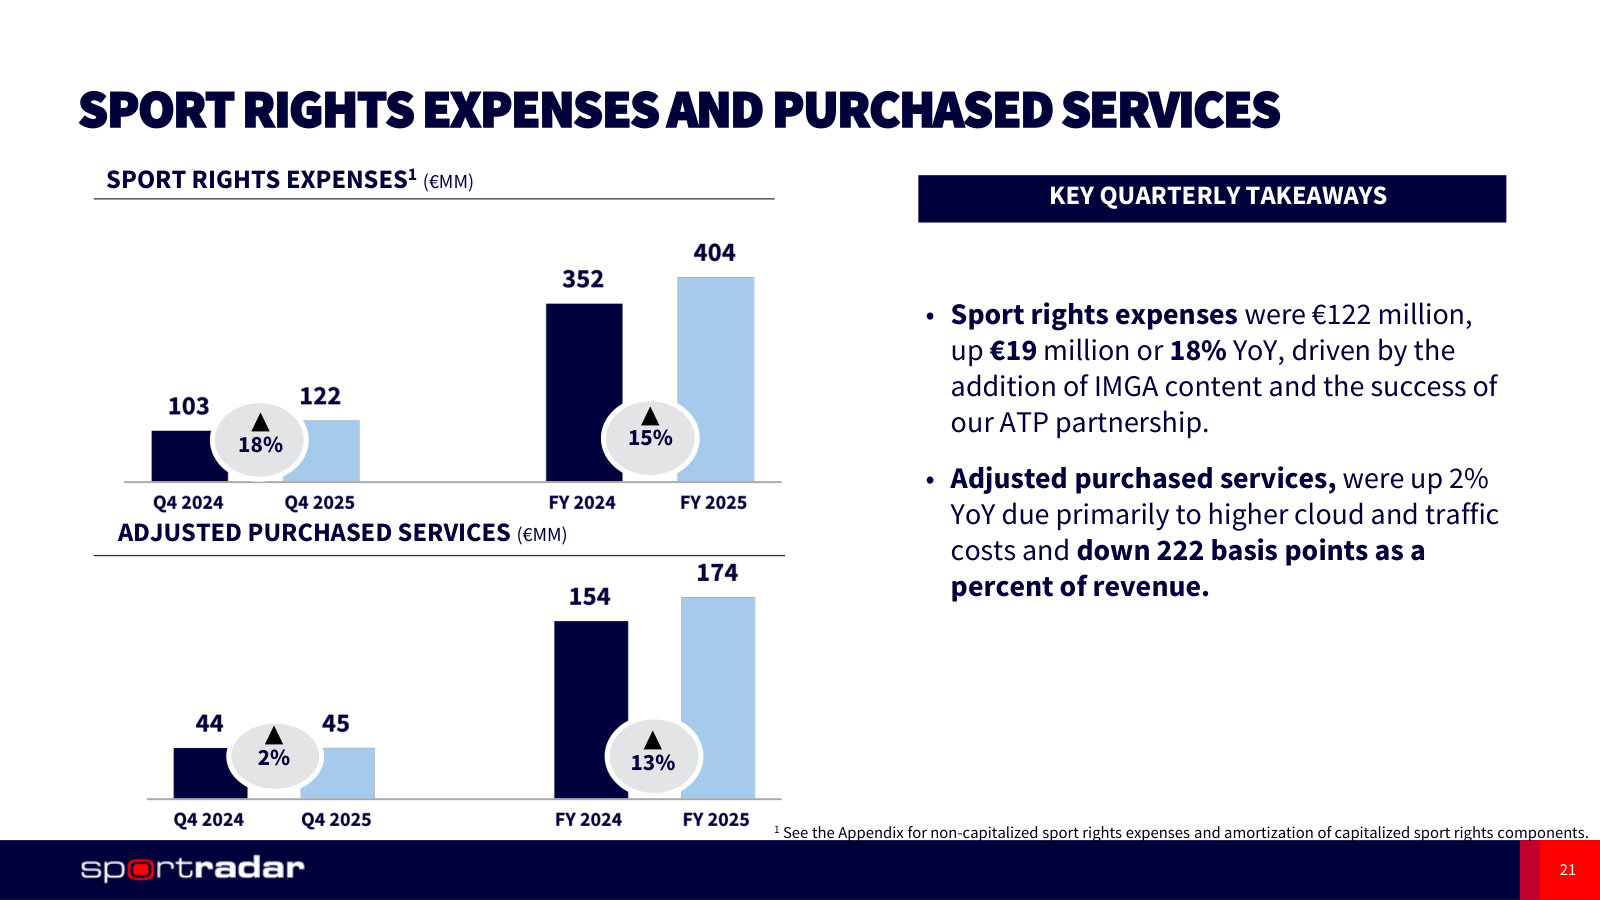
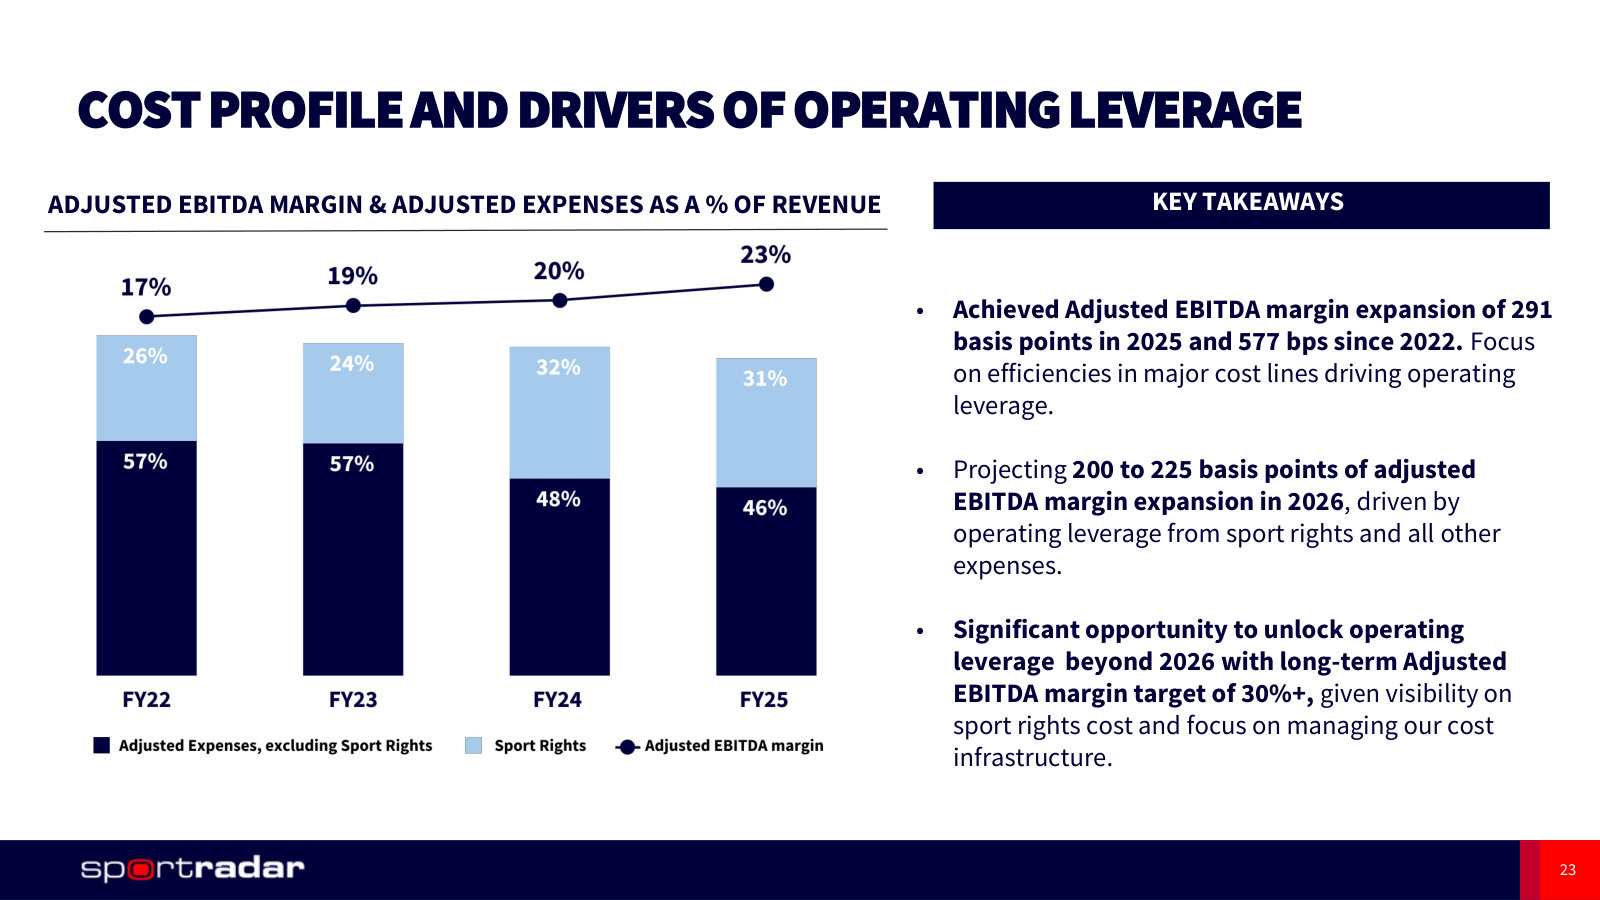
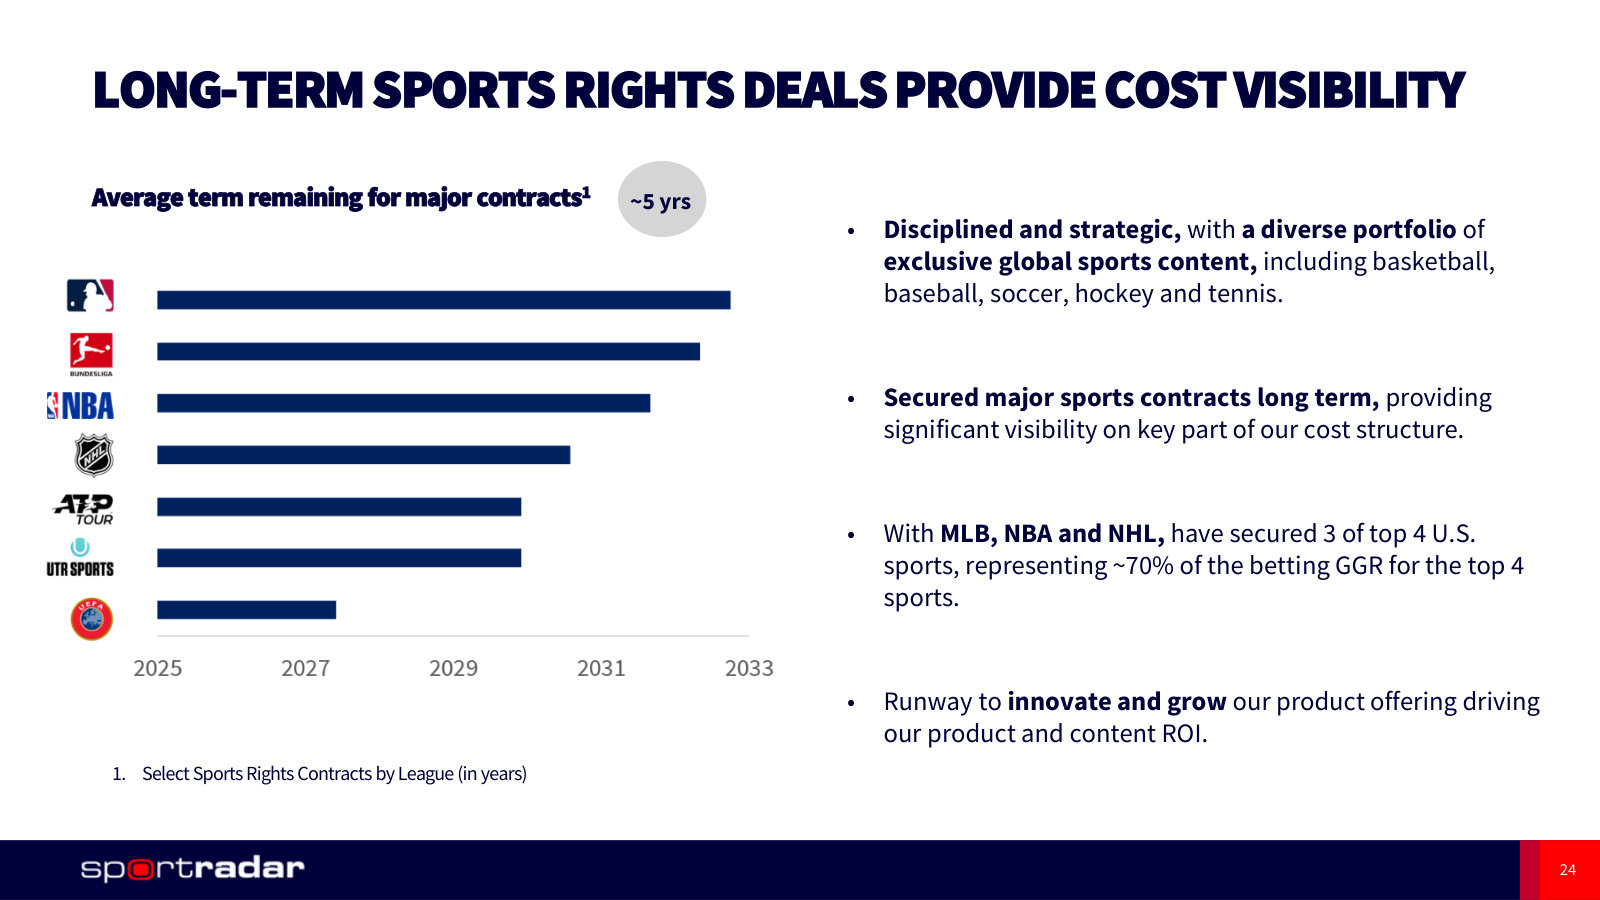
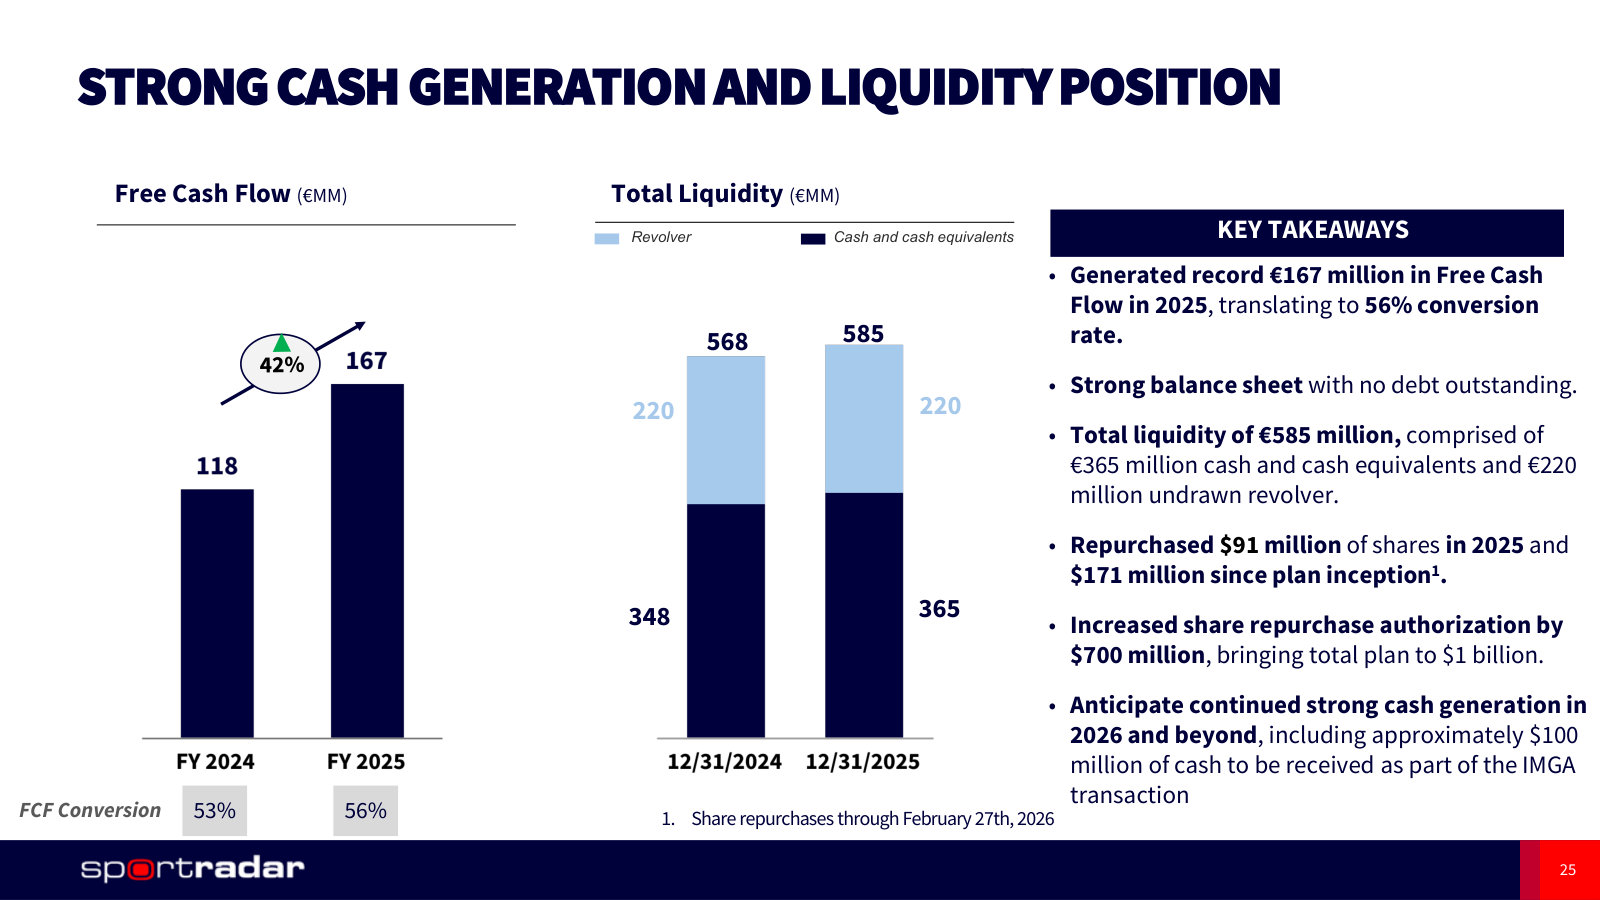
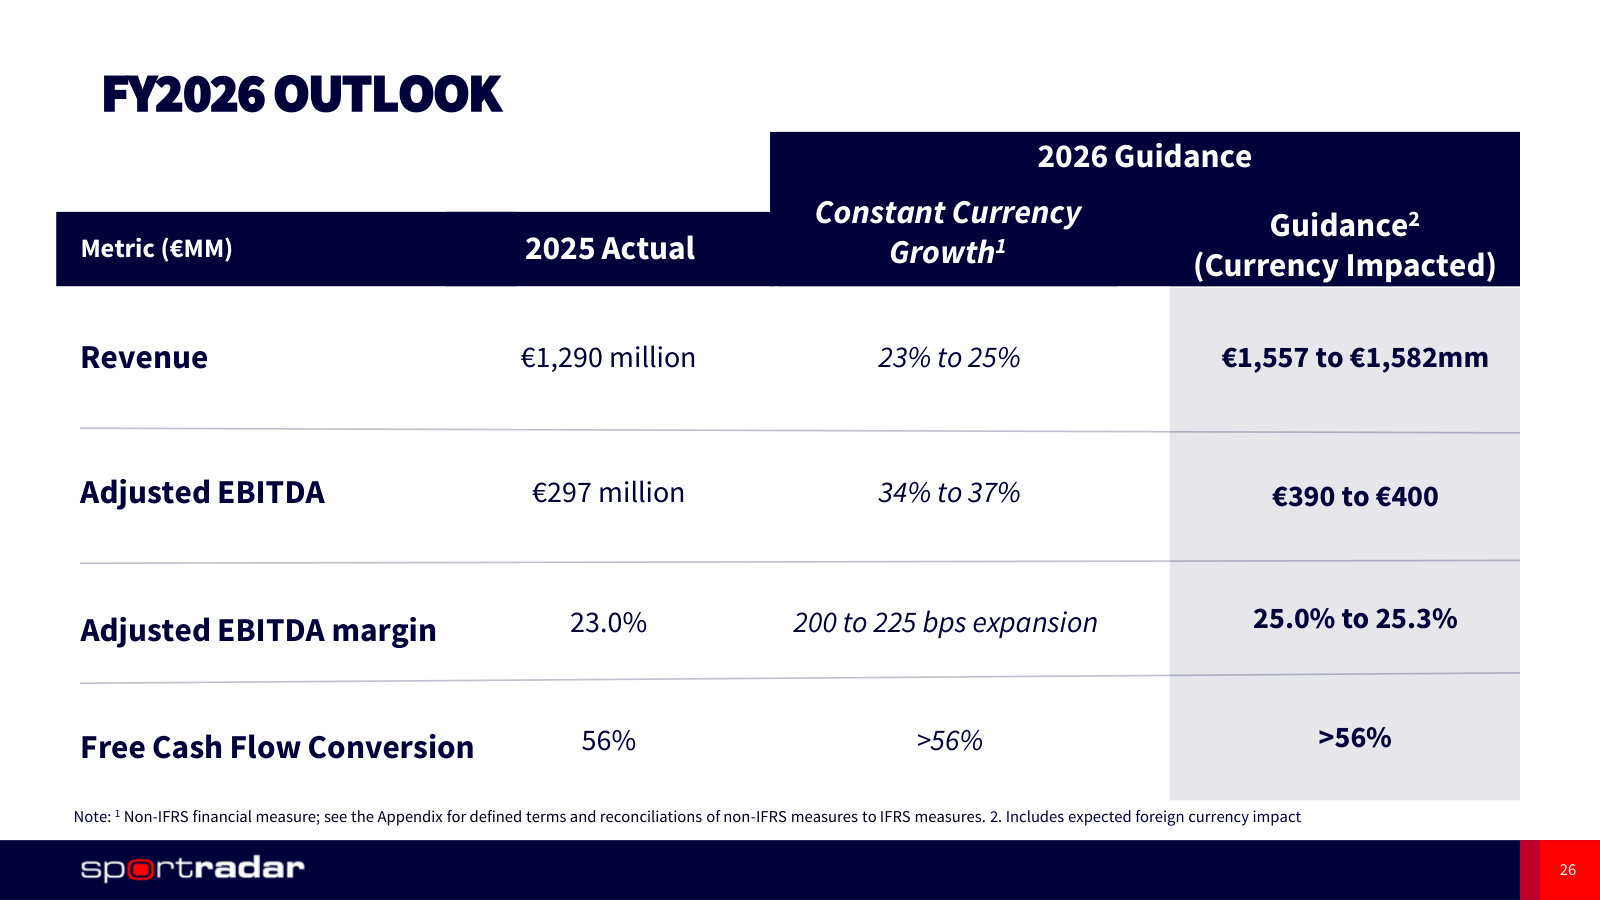
First Quarter 2026 Earnings — Q1 2026
The latest quarter, and the first place two new lines of business — prediction markets and PlayRadar — are laid out. · Open the full document →
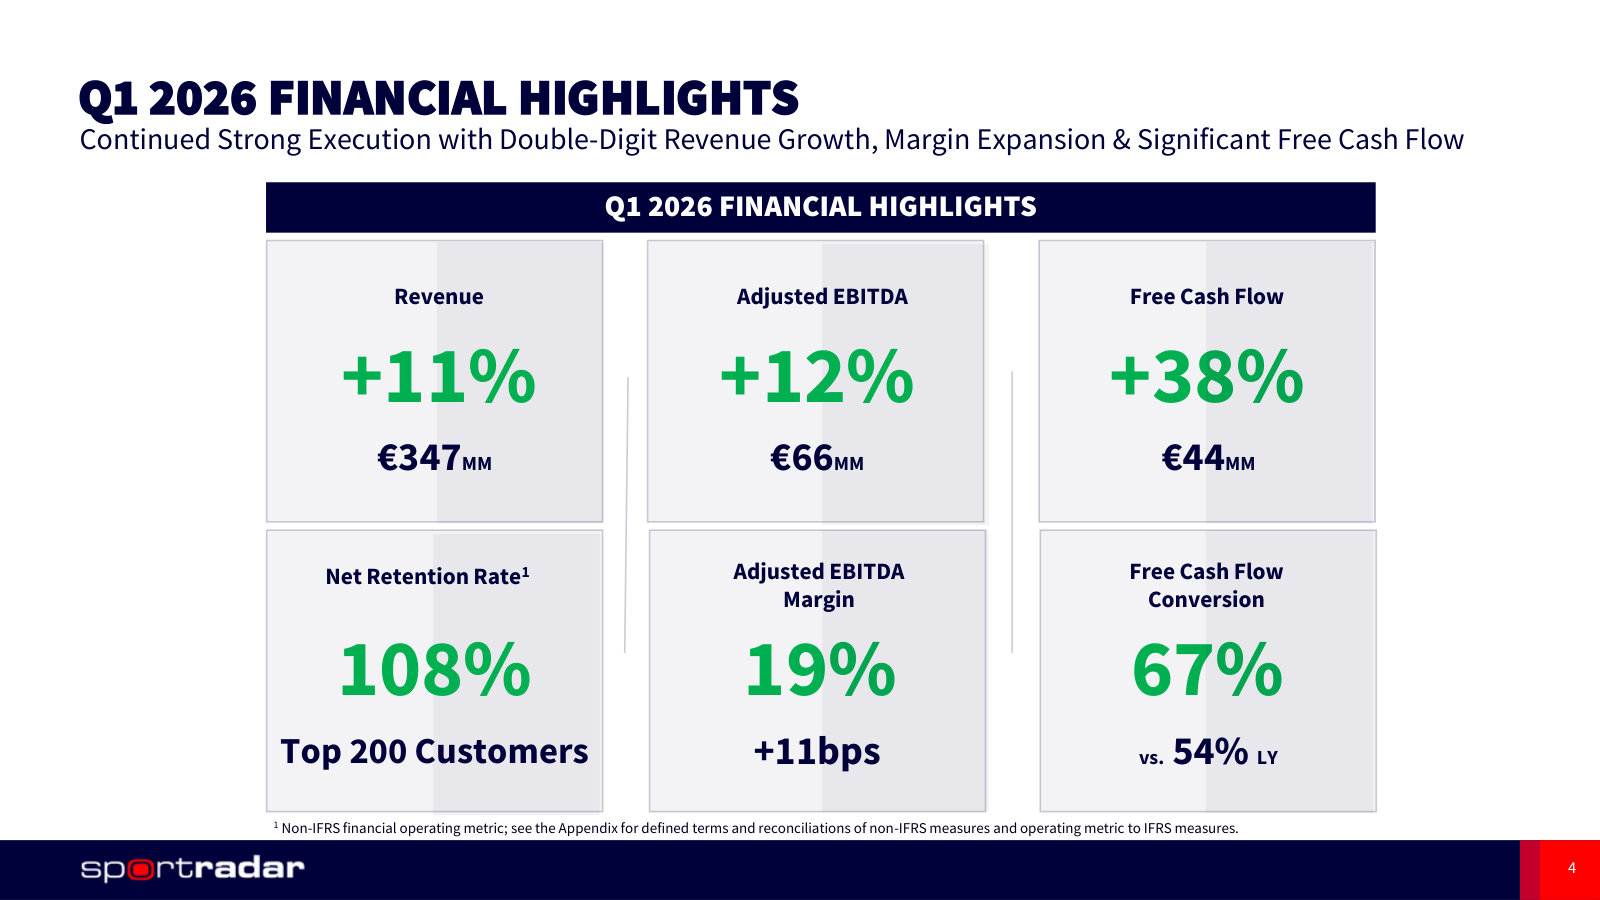
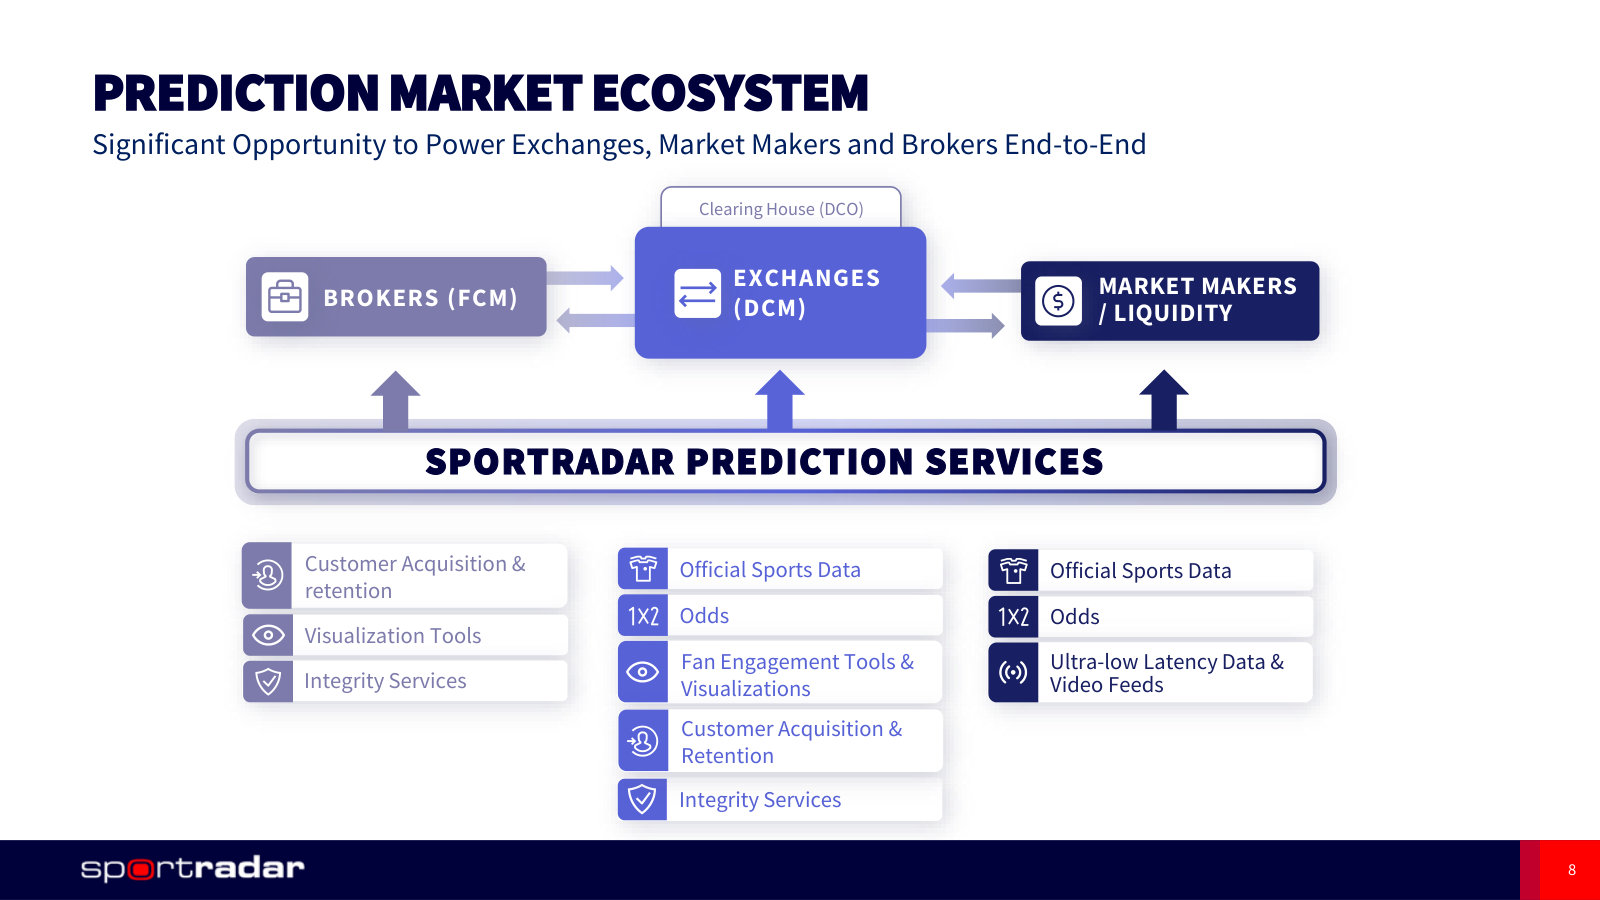
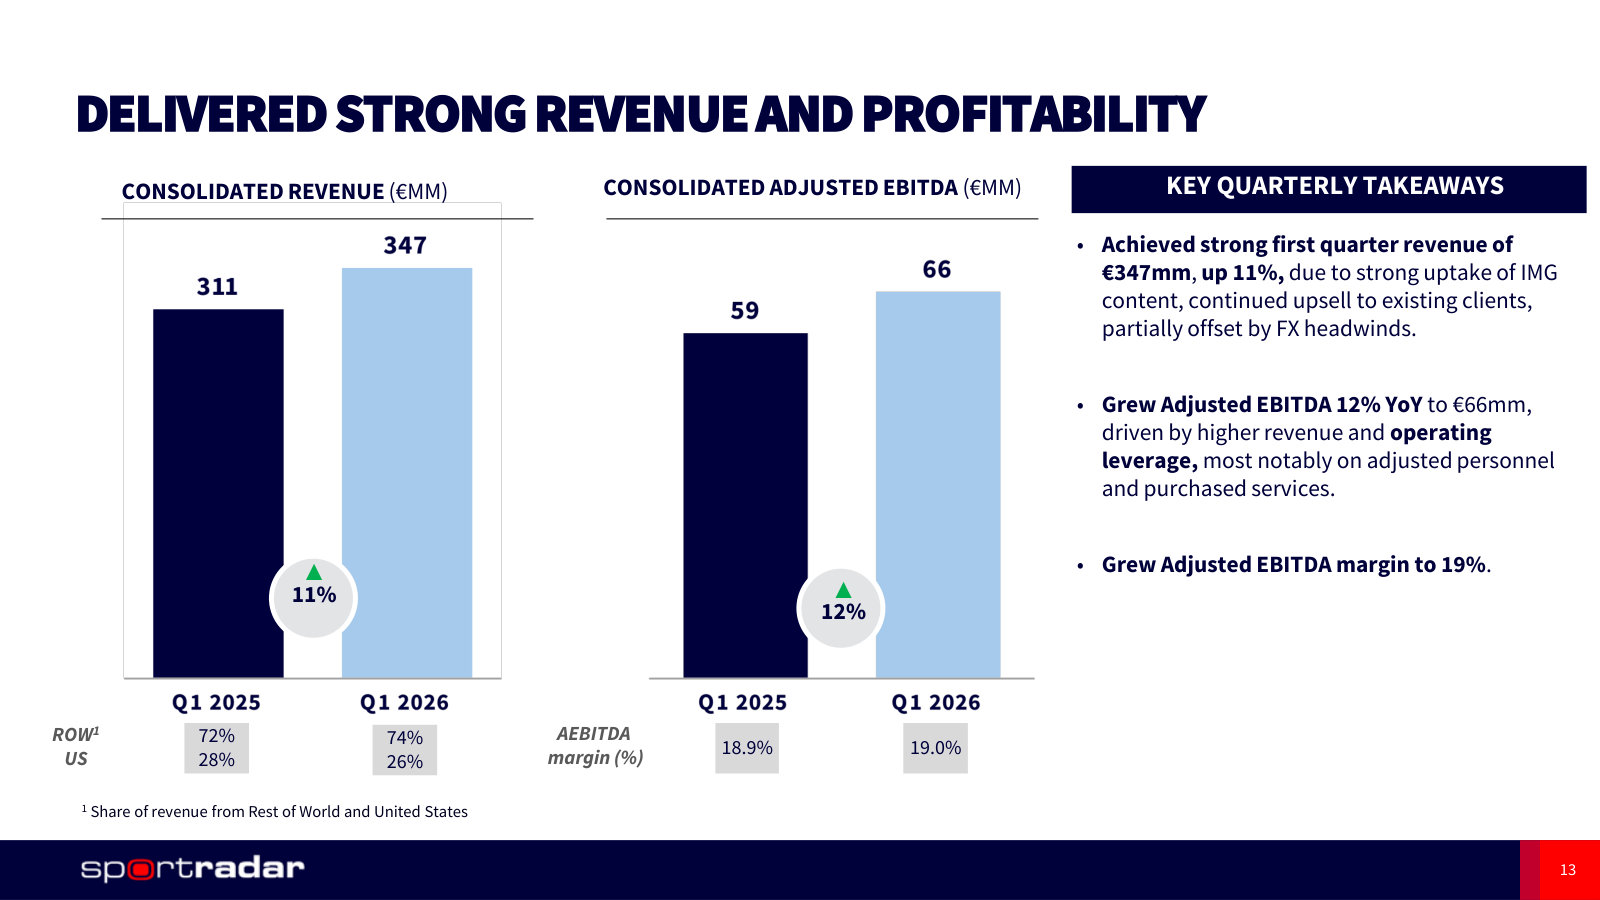
More from management
Third Quarter 2025 Earnings — Q3 2025 · 30 pages · The last quarter reported before IMG ARENA consolidated — the clean standalone run-rate of the old business. · Open →
Fourth Quarter & Full Year 2024 Earnings — FY2024 · 33 pages · Where the IMG ARENA acquisition was announced and the 2024 base year behind the 2027 targets was set. · Open →
Fourth Quarter & Full Year 2023 Earnings — FY2023 · 27 pages · The pre-Investor-Day baseline: €878m of revenue and what management was promising before the 2027 plan. · Open →
Sportradar Group AG's management answers for the business every quarter. These are the exchanges that explain it best — verbatim, from the call transcripts preserved in Sources. Each link opens the full transcript at that page in a new tab.
Q1 2026 Earnings Call — Q1 FY2026
The most recent call, and the one where management had to defend the business model line by line against short-seller allegations while re-affirming guidance. · Open the full transcript →
The clearest read on whether the IMG rights actually cross-sell: uptake rates across the existing client base.
Carsten Koerl (Chief Executive Officer): It is this scale and expertise as well as the depth of our global client base that is enabling us to make great progress integrating the IMG rights portfolio and capitalizing on revenue synergies. Demand across our global client base has been strong with more than 75% of our core betting clients now consuming IMG content, including all Tier 1 operators. Of our clients who were previously not customers of IMG, nearly 60% are now purchasing IMG content from us.
p. 9 · Read in context →
Why margins are supposed to expand mechanically — straight-line rights amortisation plus a newly announced cost programme.
Craig Felenstein (Chief Financial Officer): Overall, we continue to anticipate meaningful margin expansion over the long term, given the inherent scale we have in our business and our long-term cost visibility, including the benefits of sports rights being amortized on a straight-line basis.
At the same time, we have recently initiated steps to further streamline our business and drive additional cost eficiencies. We anticipate these steps, which are expected to result in restructuring charges of between $13 million and $18 million during the remainder of the year, will drive additional operating leverage and optimize our organizational structure for sustained value creation.
p. 14 · Read in context →
Guidance philosophy after a soft Q1: the three things management is leaning on to hold the full-year number.
Craig Felenstein (CFO); Ryan Sigdahl (Craig-Hallum Capital Group): When you think about the guidance for the full year and what we expect, we do expect marketing services to grow definitely more in line with what it's done historically, excluding any onetime items. Some of the other things that we look at with regards to guidance for the full year that we are – gives us confidence that we'll ultimately get to where we guided to at the start of the year, one would be the marketing that we just talked about. Two would be the continued success that we're seeing with IMG and how it's resonating with our customers.
And the third and probably the biggest is we have really good sight lines right now, we think, with regards to some prediction market revenue opportunity that's going to happen in the predominant in the back half of the year. So those 3 things give us confidence that we're going to hit our guidance for 2026.
p. 17 · Read in context →
The hardest question of the call — short-seller claims on unregulated markets — answered with a revenue-exposure range.
Carsten Koerl (CEO); Jeffrey Stantial (analyst): The vast majority of our clients do not operate in unregulated markets, take a Flutter or take an Entain or take a FanDuel. We subtract this, and we are coming then down to a number which is low to mid-single digit. That's where we sit. In some cases, if you let now an AI system running through this, and of course, we did simulations with public market data, that might drop into the range of a maximum of 12%. We believe it's a low to mid-single-digit number of our total revenues, which are exposed. I hope that clarifies the situation.
p. 23 · Read in context →
Management's case that prediction markets expand the addressable market faster than they cannibalise sportsbook volume.
Carsten Koerl (CEO); Raymond Bowers (Wells Fargo): So that is a big population, which can now get an opinion on a sport event and monetize on this. That is in principally an expansion of the TAM. We might also discuss there is a TAM expansion because the age is dropping to 18. That's at the moment what we see. So we see that this additional market access is by far outpacing whatever cannibalization effect is in there. […] What I can tell you from talks with the CEOs of our clients is that the cannibalization is pretty small here. So looking to this, we see an outpacing TAM. We see an expansion opportunity for us, and this is something which excites us.
p. 27 · Read in context →
The contract structure in one answer: two-thirds fixed fee, one-third variable, with roughly a third of fixed repricing yearly.
Craig Felenstein (CFO); Shaun Kelley (Bank of America): So when you think about our company, about 2/3 of our revenue are fixed fee, 1/3 are variable out of the 2/3 that are fixed. Traditionally, about 1/3 comes up every single year, and that's not obviously on January 1. It comes up throughout the course of the year.
p. 32 · Read in context →
Q4 and Full Year 2025 Earnings Call — Q4 FY2025
The annual call: full-year economics, the first full read on IMG integration, and the 2026 framework the company is now being judged against. · Open the full transcript →
The stated synergy target for IMG — 25% revenue uplift — and the flywheel logic behind it.
Carsten Koerl (Chief Executive Officer): The customer response has been strong with the majority of our clients, including all of the tier one partners, having already signed on the IMG data odds and AV products. This early and significant progress puts us firmly on track to unlock anticipated revenue synergies of 25% for IMG in 2026. On the product side, we have successfully integrated IMG content into our core product suite and are on track to expand it into our next-gen offerings, including Foresight, Micro Markets, Player Props, and the Virtual Live Match Tracker over the course of the year. This rapid integration and uptake validates our flywheel. We can monetize this content across more customers and products to unlock significant accretive revenue growth.
p. 8 · Read in context →
Scale in two numbers: matches streamed and $52bn of managed-trading turnover, which is what the odds and trading products run on.
Carsten Koerl (CEO): Last year, we streamed over 525,000 matches, which is 100,000 more than we streamed just two years ago. In 2026, we anticipate to stream over 700,000 matches across our global footprint. Switching to our Managed Trading Services, we continue to scale this business in related markets around the globe, we see continued strong momentum ahead. Turnover for 2025 was up 26% year-over-year to $52 billion, making us a top bookmaker globally.
p. 9 · Read in context →
Full-year 2025 in one passage — 17% revenue growth converting into 33% EBITDA growth and 290bp of margin.
Craig Felenstein (Chief Financial Officer): Total company revenue for the full year of $1.3 billion increased $183 million or 17% compared with 2024, driven in large part by higher uptake from our existing partners, strong U.S. market growth, record Managed Trading Services turnover, and contributions related to IMG content. Our growth was broad-based with strength across our product portfolio, including betting and gaming content, Managed Trading Services, and our marketing and media services business.
We generated strong gains both in the U.S. and globally with the U.S. up 23% year-onyear, now 25% of our total revenue, and the rest of the world up 15%. Importantly, the steps we have taken to align our cost base with the revenue opportunities are enabling us to deliver significant operating leverage. Record Adjusted EBITDA of $297 million for the year increased $74 million or 33% compared with a year ago. The company increased full year Adjusted EBITDA margins by over 290 basis points to 23%.
p. 12 · Read in context →
Unit economics of the iGaming push: an iGaming player is worth about 4x a sports bettor, with sports betting as the acquisition channel.
Carsten Koerl (CEO); Chad C. Beynon (Macquarie Capital): This is exactly the opportunity which we pick because we see we have the distribution, we have the iPlayer, we have the live scores, we have the match trackers on the bookmaker side, and we can connect this and convert. Like we all know and like we see it in the handle numbers, a client gets roughly around about 4 times the value for an iGaming player comparing it to a sports bettor. Sports betting is used as the acquisition channel, and here it closes to the 360 degree because we hook it up with our ads for the acquisition. That is the scale.
p. 21 · Read in context →
Where Sportradar thinks it can sell into prediction markets — real-time pricing data for market makers, not just feeds.
Carsten Koerl (CEO); Shaun Kelley (Bank of America): The real interesting thing is the live development in that sector. In-play parlays, live opportunities, that needs real-time data. Like we all know, this is where we can monetize best with the real-time data. The market maker segment is specifically interesting because they need real-time data to price this, and they need the models to lay the liquidity there. Even more, and the real goal is, can we predict the next movement better than anybody else? We can because we are sitting on this huge knowledge, we are sitting on the liquidity, and we are sitting on the deep data in real time.
Our investment here, for example, in the foundation model, where we can predict the next pixel, and we do this now seven seconds for an NBA match, is super helpful to predict potential moves and to underlie them with liquidity. That is exactly where the sweet spot sits. As you hear, that makes us very optimistic that we can help the market makers with a very superior product.
p. 22 · Read in context →
Buyback mechanics stated plainly: a price-sensitive grid, with opportunistic top-ups.
Craig Felenstein (CFO); Jordan Bender (analyst): When you think about how we buy back our shares, we predominantly buy back according to a grid. We have done that historically. We are opportunistic on top of that, like we were with our secondary buyback in the middle of last year.
p. 27 · Read in context →
A rare piece of self-limiting sizing — prediction markets framed as tens of millions, not hundreds.
Carsten Koerl (CEO); Bernie McTernan (Needham): we expect an uplift opportunity in the $ tens of millions, not in the $ hundreds of millions, from prediction markets. Looking on the global scale, yes, we have to focus to keep that machine running, which is internationally significantly bigger than inside the U.S.
p. 34 · Read in context →
Which half of the IMG synergy case is bankable: cost savings are identifiable, revenue synergies depend on client dialogue.
Craig Felenstein (CFO); Bernie McTernan (Needham): Sure. I would say we are not saying that our revenue synergies are fully baked in. Obviously, a lot of this comes down to what sort of content our customers wanna take, what kind of products we develop that we can ultimately sell to our customers. I would say there is definitely some additional revenue upside that can be had from an IMG perspective, depending on the dialogue that we have with our clients. On the cost side, I think I would not say that they are baked into 2026, but I would say that they are easier to identify.
p. 34 · Read in context →
Q4 and Full Year 2024 Earnings Call — Q4 FY2024
The call where the IMG ARENA acquisition and the MLB renewal were laid out, together with the clearest statement of how Sportradar underwrites sports rights. · Open the full transcript →
The IMG ARENA acquisition announced — the deal that reshapes the rights portfolio.
Carsten Koerl (Chief Executive Officer): As you may have already seen this morning, we announced that we are further expanding our leading global content portfolio as we entered into an agreement with Endeavor and WME-IMG to acquire IMG ARENA and its global sports betting rights portfolio. I am incredibly excited about this acquisition, which enhances our footprint in some of the most bet-upon sports, including tennis, soccer, and basketball, and will deliver significant value to our clients, partners, and shareholders. The deal, once closed, is expected to be immediately accretive to our business and margins.
p. 4 · Read in context →
MLB takes equity alongside a renewal; management ties rights discipline to the confidence to buy IMG's portfolio.
Carsten Koerl (CEO): As part of the agreement, MLB has also taken an equity stake in Sportradar, further solidifying our long-term partnership. The disciplined approach we have taken with our existing sports rights and the strong returns we are generating is what gave us confidence in the opportunity to acquire the portfolio of rights from IMG ARENA.
p. 5 · Read in context →
What was actually acquired, sized: 70+ rightsholders, ~39,000 data events, and 70% concentrated in the three biggest betting sports.
Carsten Koerl (CEO): Maximizing the value of high-demand content for our clients and league partners is what we do best, and this portfolio, comprised of relationships with over 70 rightsholders and covering approximately 39,000 oficial data events and 30,000 streaming events across 14 global sports on six continents, provides a variety of growth avenues. Importantly, approximately 70% of these rights are spread across the top 3 sports for global betting turnover, basketball, soccer, and tennis, greatly enhancing our status as the No. 1 content provider in core betting sports while also expanding our content offerings in emerging live betting sports.
p. 5 · Read in context →
The unusual consideration: Endeavor pays Sportradar to take the portfolio on.
Carsten Koerl (CEO): Instead, Endeavor will be providing financial consideration of $225 million, including cash compensation of $125 million to Sportradar and up to 100 million to certain sports rightsholders, which will reduce our future obligations.
p. 6 · Read in context →
How trading data feeds the advertising business — 80 million bettors' behaviour lowering client acquisition cost.
Carsten Koerl (CEO): MTS has value outside the pure trading and risk management, providing us with unique insights into bettors across hundreds of books. By managing the bets of 80 million unique bettors last year alone, we are able to gain a deeper understanding of their preferences and dynamics. This insight informs our ads business and our ability to target, acquire, and engage sportsbook customers at a lower acquisition cost than other peers.
p. 8 · Read in context →
The distribution argument for the deal — 800 bookmakers, 900 media companies — and the ATP precedent for monetising acquired rights better.
Carsten Koerl (CEO); Ryan Sigdahl (Craig-Hallum Capital Group): One is the strategic one. The second one is the commercial one. Looking to the strategic, we scale and we are the premium provider for the B2B sports, so that makes us even stronger. Looking to the coverage, we expand the coverage, and we do this in our key sports.
That's tennis, that's basketball, that's soccer. That's very complementary. Looking to our ability, and you touched on this, we saw what has happened with ATP, which we took from IMG beginning of 2024. We managed this property significantly better, and that is given the scale which we have.
We have 800 bookmakers. We have 900 media companies connected to this machine. And this is a well-oiled machine. We are global from a footprint, and we simply have to leverage on this. Looking now to the commercials, the deal is accretive to the revenues, obviously. It is accretive to the margin, and it's accretive to cash flow. So, the ROI which we deliver with this deal is sensational, and that is the reason why we are so excited about it.
p. 16 · Read in context →
Pressed on buying a loss-making asset, Carsten sets out the rights underwriting test and the ~$100m spent repricing deals.
Carsten Koerl (CEO); Robin M. Farley (UBS): We look to each and every right. We look to the revenues, what they generate.
And we looked to our upselling abilities and the cross-selling abilities. We looked into can we use this content if we put it in our engine to get more revenue channels than they have. And then we're coming to a picture and saying, well, we believe, with this content, we can generate those revenues. And that was the first criteria.
Second was is this accretive to our EBITDA? That is a very, very clear point of decision and saying if we are doing something which is not accretive, we are not interested. And that's the reason why we did the deal. So, it's accretive to our EBITDA and it's accretive to the cash. We needed some money to repair some deals, only a few, which are probably not in the current market from a pricing perspective, and that's what you see in the segments.
We said around about 100 million has been used in prepayments to the leagues to get those deals more in line with market conditions that we can monetize on them.
p. 24 · Read in context →
Capital allocation stated as a ranked test: reinvest, then M&A, both gated on margin accretion, then buybacks.
Craig Felenstein (Chief Financial Officer); David Katz (Jefferies): But I will say this, it is always one of three options that we have. We are always looking at ways to invest in our existing core assets. Given the high margins we have in our existing business, we want to continue to expand the margins in our existing business, and we're not going to jeopardize that by putting too much money back into the business. Same goes for any M&A opportunity.
It has to be margin-accretive for us to do it. So, if we can't find either of those two things, then we will go ahead and return capital to shareholders. And because of the cash we have, we do have the ability to do both.
p. 28 · Read in context →
Q3 2021 Earnings Call — Q3 FY2021
The first calls as a public company, and still the best zero-to-one explanation of the model — rights, liquidity, MTS pricing power — alongside the landmark NBA renewal. · Open the full transcript →
Why the global business dwarfs the US one: soccer handle versus NFL handle, stated in euros.
Carsten Koerl (Chief Executive Officer): Soccer is the most bet on sport in the world with a handle of 850 billion euros each year, far exceeding the handle of American sports, such as the NFL, which is 41.87 billion annually.
p. 8 · Read in context →
The exclusivity philosophy, tested against the NFL loss: exclusive only where the economics work, and no betting client lost.
Carsten Koerl (CEO): I'll close my discussion around the data rights deals by addressing our position on exclusive data.
We seek exclusive data deals only when the economics make sense. But we also have access to enormous amount of data that we are able to monetize, even if we don't have exclusive rights. I'm pleased to say that we have not lost a single betting client due to not having the exclusive rights to NFL data. We have kept our position as the preferred supplier for every U.S.
betting operator and did not lose any existing contracts.
p. 9 · Read in context →
What Managed Trading Services actually is, and the customer count behind it — the base for a product now central to the model.
Carsten Koerl (CEO): Our MTS offering is a sophisticated, turnkey trading, risk, live odds, and liability management solution that helps betting operators boosting margins and profits while increasing eficiency and managing risks.
Overall, we grew our MTS customers from 158 globally in the third quarter of 2020 to 192 globally, this quarter.
p. 10 · Read in context →
The rationale for the landmark NBA renewal — live betting, not pre-match, is what the rights were bought for.
Carsten Koerl (CEO); David Karnovsky (J.P. Morgan): Yes. Good question, David. So, this deal was a long effort, and we discussed it since quite a while with our partners, and we're super happy that we could announce it today. The U.S.
is undoubtedly the biggest growth opportunity which we see in front of us, and we want to focus on creating value, so investments in the United States are our top priority. The NBA is the top betting sports in the United States by pre-match, but more important by live. Live is something that we see main trend in the United States, and we see a lot of opportunities to monetize here with our live odds and with our managed trading services products. This was a main motivation.
p. 15 · Read in context →
On leagues taking equity: treated as an exception for the NBA, not a template — a commitment worth checking against later deals.
Carsten Koerl (CEO); Jason Bazinet (Citi): As a very general statement, I think you will not see too many equity deals from Sportradar, like we did it now with the NBA. The NBA is our most important partner, was our most important partner from the scope and from the size, and also looking to the extensive partnership. So, that was a very clear step for us to do this, to group with our partner where we enjoyed in the last seven years a sensational cooperation.
p. 18 · Read in context →
The core economic engine explained: aggregated betting liquidity becomes pricing power through AI-set fair prices.
Carsten Koerl (CEO); Shaun Kelley (Bank of America Merrill Lynch): The more tickets and liquidity you aggregate, the better you are in a position to use AI to compile what we call a fair price. And that gives you over the long term, if you have more liquidity and diversity, pricing power for this.
I think that's not disputed from one of the players in the market. It's only the question how quickly can you reach a position if your pricing power is big enough to generate alpha with the prices.
p. 24 · Read in context →
The insourcing threat answered on its merits — operators build only where a supplier cannot serve them better.
Carsten Koerl (CEO); Shaun Kelley (Bank of America Merrill Lynch): I think, whenever we can provide superior service to our clients, the bookmakers, they will not hesitate to take it. And there are some bookmakers which simply might see that there is an edge if they have their own platform. I think in a very general way, the platform is a software business. And the sports betting operators which have to do the branding, the marketing, the licensing, a lot of daily operations, I think there are very qualified companies doing software development and managing the modules like I just said it to you. That's our opinion about the debate of insourcing and outsourcing. I think it's simply weighted by who can provide the more eficient and better service that our clients can have a better offer and be more profitable. And this is the decision point.
p. 24 · Read in context →
More calls
Q3 2025 Earnings Call — Q3 FY2025 · 36 pages · Where the IMG ARENA close and the initial 23%-25% constant-currency 2026 growth framework were first put on the table. · Open →
Q2 2025 Earnings Call — Q2 FY2025 · 33 pages · Go here for the pre-close IMG regulatory path and the mid-year check on the Investor Day targets. · Open →
Q1 2025 Earnings Call — Q1 FY2025 · 32 pages · The first call after the April 2025 Investor Day, restating the medium-term growth and margin targets in Q&A. · Open →
Q3 2024 Earnings Call — Q3 FY2024 · 31 pages · The quarter management points to as the operating-leverage inflection, with the ATP and NBA rights costs already in the base. · Open →
Q4 and Full Year 2023 Earnings Call — Q4 FY2023 · 34 pages · The investment-year defence: guiding through the first full year of stepped-up NBA and ATP rights expense. · Open →
Q3 2023 Earnings Call — Q3 FY2023 · 36 pages · The quarter the renewed NBA deal economics began hitting the P&L, with management setting expectations for the cost step-up. · Open →
Q4 and Full Year 2022 Earnings Call — Q4 FY2022 · 26 pages · Carsten's value-chain ladder — data, then predictive models, then trading, then platform — plus the ATP rights win and the Vaix AI acquisition. · Open →
Q4 and Full Year 2021 Earnings Call — Q4 FY2021 · 38 pages · The original post-IPO guidance framework and segment reporting, useful as the baseline the later margin story is measured from. · Open →
Sportradar Group AG's annual reports contain management's most considered account of the business. These are the sections, passages and visual pages worth opening in the originals preserved in Sources.
Sportradar Group AG — FY2025 Annual Report (Form 20-F) — FY2025
€1.29bn revenue, the IMG ARENA acquisition, prediction markets as a new competitive vector, and a second year of failed internal control. · Open the full document →
We depend on the success of our strategic relationships with our sports league partners, and our inability to maintain, extend, or establish new relationships may cause loss of competitive advantage, unanticipated costs, or require us to modify, limit, or discontinue certain offerings, which could materially affect our business, financial condition, and results of operations. — p. 13 · Read the full section →
The supply side of the business: rights it does not own, renewed on someone else's terms, now bid for by prediction markets too.
Our market is competitive and we may lose clients and relationships to both existing and future competitors. Potential changes in competitive landscape, including new market entrants or disintermediation by participants in the industry, could harm our business. In addition, the introduction of sports-event contracts trading offered by prediction markets creates uncertainty affecting our business. — p. 14 · Read the full section →
New this year: CFTC-regulated event contracts sit outside the state betting regime Sportradar's clients are licensed under.
Prediction markets framed as opportunity and threat at once, across competitive, regulatory and contractual lines.
In the United States, prediction markets, which are CFTC-regulated platforms that allow participants to trade event contracts based on the outcome of future events, are emerging as a potential innovation in sports engagement and data monetization. While these prediction markets has created and could create more opportunities for us to leverage our data and other products and services, they also present significant uncertainties. These uncertainties include, among others, competitive risks, regulatory risks and contractual risks.
p. 14 · Read in context →
The dual class structure of our ordinary shares has the effect of concentrating voting power with our Founder, which will limit a shareholder’s ability to influence the outcome of important transactions, including a change in control. — p. 42 · Read the full section →
Class A holders own economics, not control: the founder holds 78.5% of voting power through low-par Class B shares.
Founder voting power at December 31, 2025, and what it forecloses.
As of December 31, 2025, our Founder, Carsten Koerl, holds all of the issued and outstanding shares of our Class B ordinary shares, which, together with his outstanding Class A ordinary shares, constitutes 78.5% of the total voting power of our outstanding share capital. Accordingly, our Founder is able to significantly influence matters submitted to our shareholders for approval, including the election of directors, amendments of our organizational documents and any merger, consolidation, sale of all or substantially all of our assets or other major corporate transactions. […] This concentrated control may have the effect of delaying, preventing or deterring a change in control of our company, could deprive our shareholders of an opportunity to receive a premium for their share capital as part of a sale of our company and might ultimately affect the market price of our Class A ordinary shares.
p. 42 · Read in context →
Item 4.B Business Overview — p. 48 · Read the full section →
Management's own definition of the business, and the rights portfolio it treats as the moat.
What Sportradar sells and to whom, in management's words.
Sportradar is a leading technology platform enabling next generation engagement in sports and the number one provider of B2B solutions to the global sports betting industry based on revenue. We provide mission-critical products, data and content to sports leagues and federations, betting operators and media companies. […] We offer one of the most robust platforms with seamless integrations between leagues, betting operators and media companies. This enables us to be a trusted partner and leader in navigating the complexities of the highly regulated betting industry. Our software solutions cover a broad range of the sports industry needs, from data collection and processing to visualization, risk management, and platform services.
p. 48 · Read in context →
The named Tier 1 exclusive rights behind the moat claim.
We also leverage our highly diversified sport rights partnerships as a key competitive advantage for our product offerings and client solutions. We have strategically cultivated sport partnerships that include a range of exclusive rights with many Tier 1 properties, including, but not limited to, the National Basketball Association (“NBA”), Major League Baseball (“MLB”), the National Hockey League (“NHL”), the PGA Tour, Major League Soccer (“MLS”), Association of Tennis Professionals (“ATP”), Fédération Internationale des Associations de Football (“FIFA”), the South American Football Confederation (“CONMEBOL”), Union of European Football Associations (“UEFA”), the Asian Football Confederation (“AFC”), and the Deutsche Fußball Liga (“DFL”).
p. 49 · Read in context →
Key Financial and Operational Performance Indicators — p. 67 · Read the full section →
The scoreboard management runs on, plus its argument for why sport rights amortization stays inside Adjusted EBITDA.
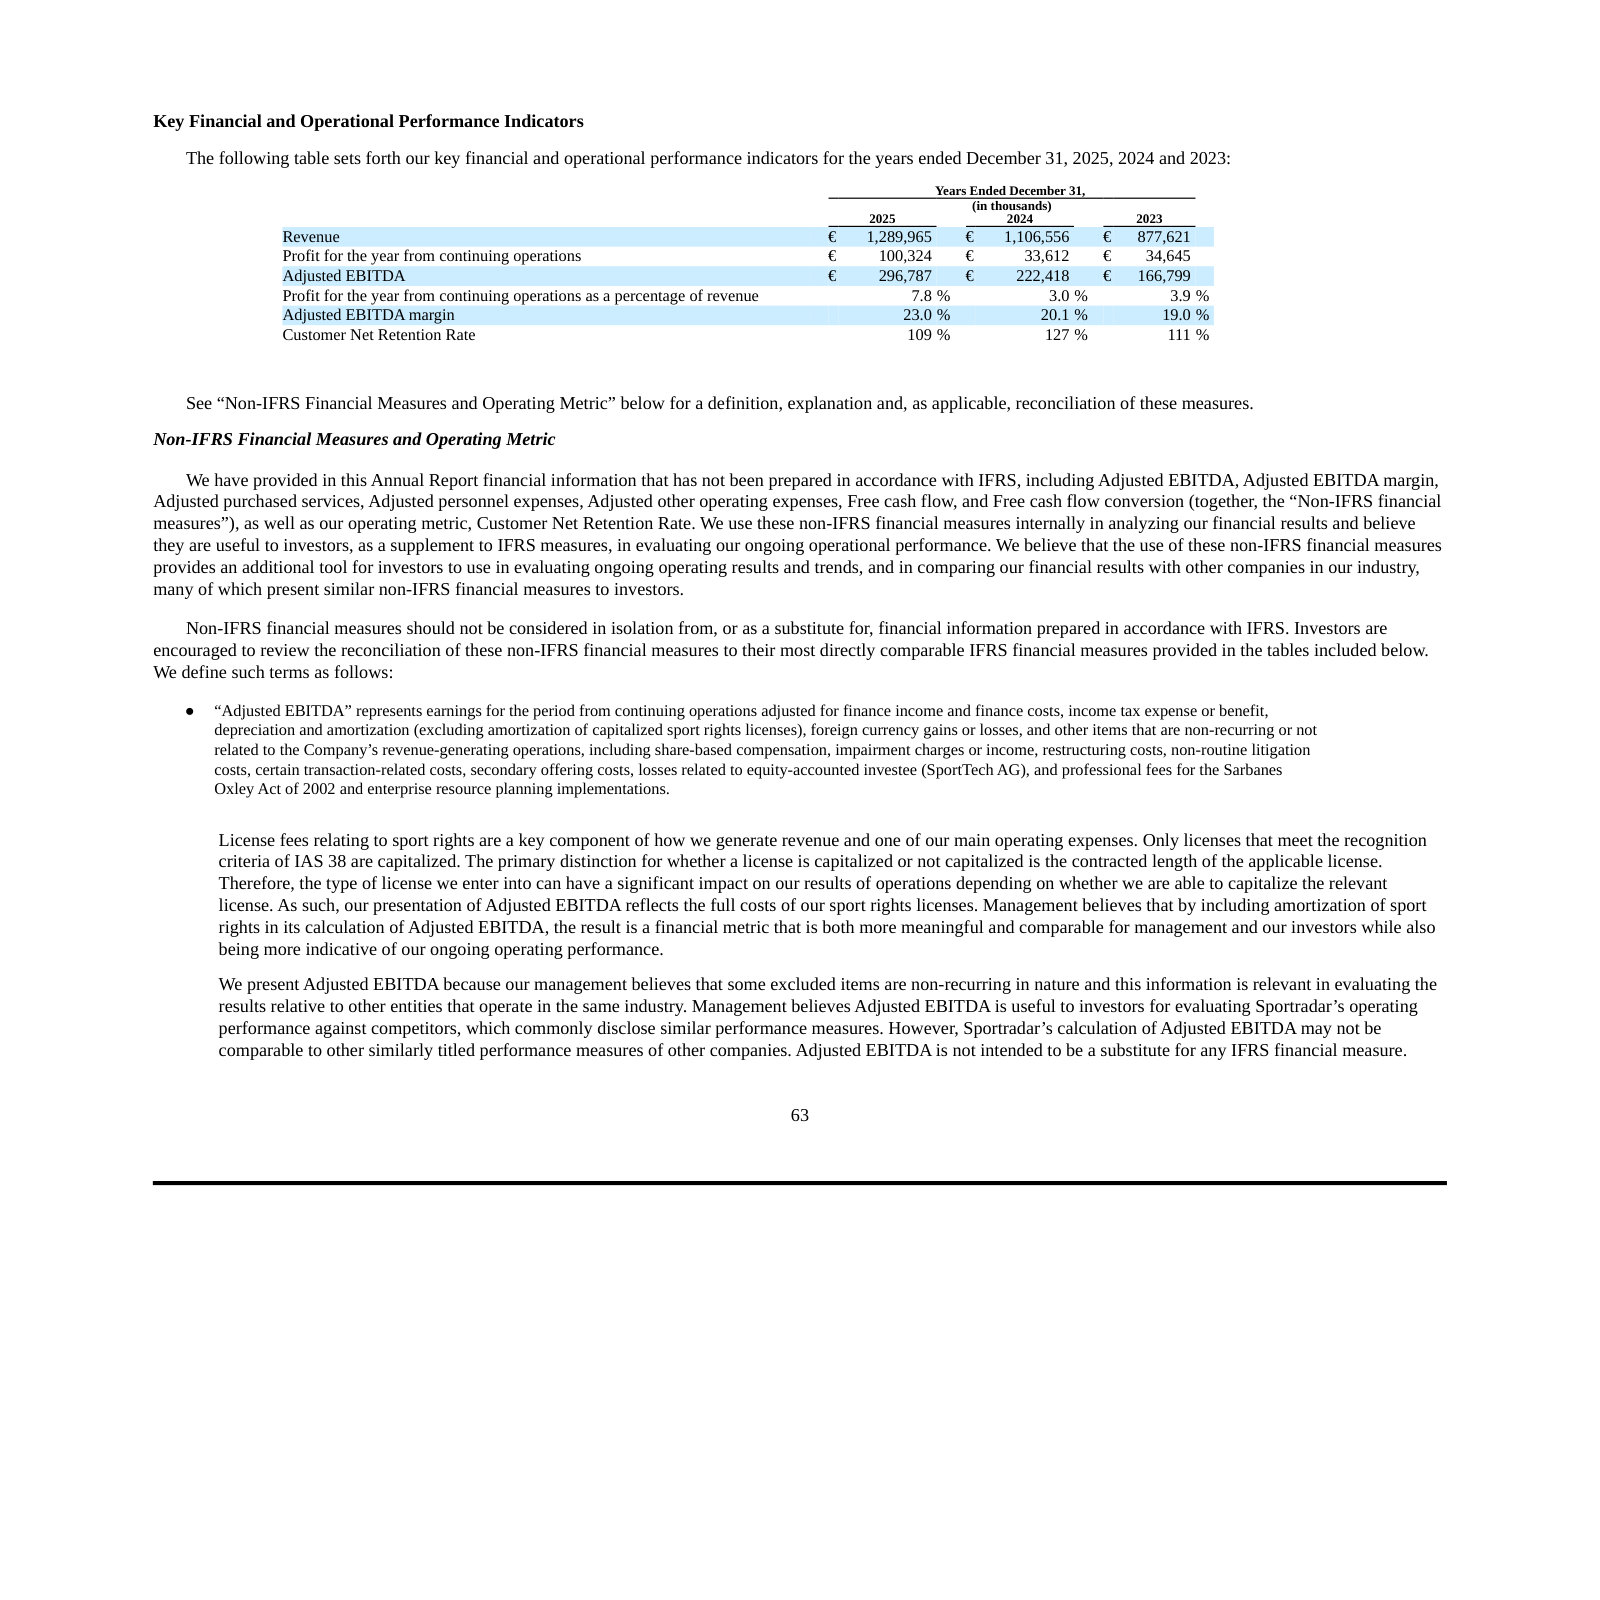
Why the capitalize-or-expense choice on licenses drives reported results.
License fees relating to sport rights are a key component of how we generate revenue and one of our main operating expenses. Only licenses that meet the recognition criteria of IAS 38 are capitalized. The primary distinction for whether a license is capitalized or not capitalized is the contracted length of the applicable license. Therefore, the type of license we enter into can have a significant impact on our results of operations depending on whether we are able to capitalize the relevant license. As such, our presentation of Adjusted EBITDA reflects the full costs of our sport rights licenses.
p. 67 · Read in context →
Components of our Results of Operations — Revenue — p. 71 · Read the full section →
How the money is actually made: five revenue lines, and contracts split between fixed minimums and GGR revenue share.
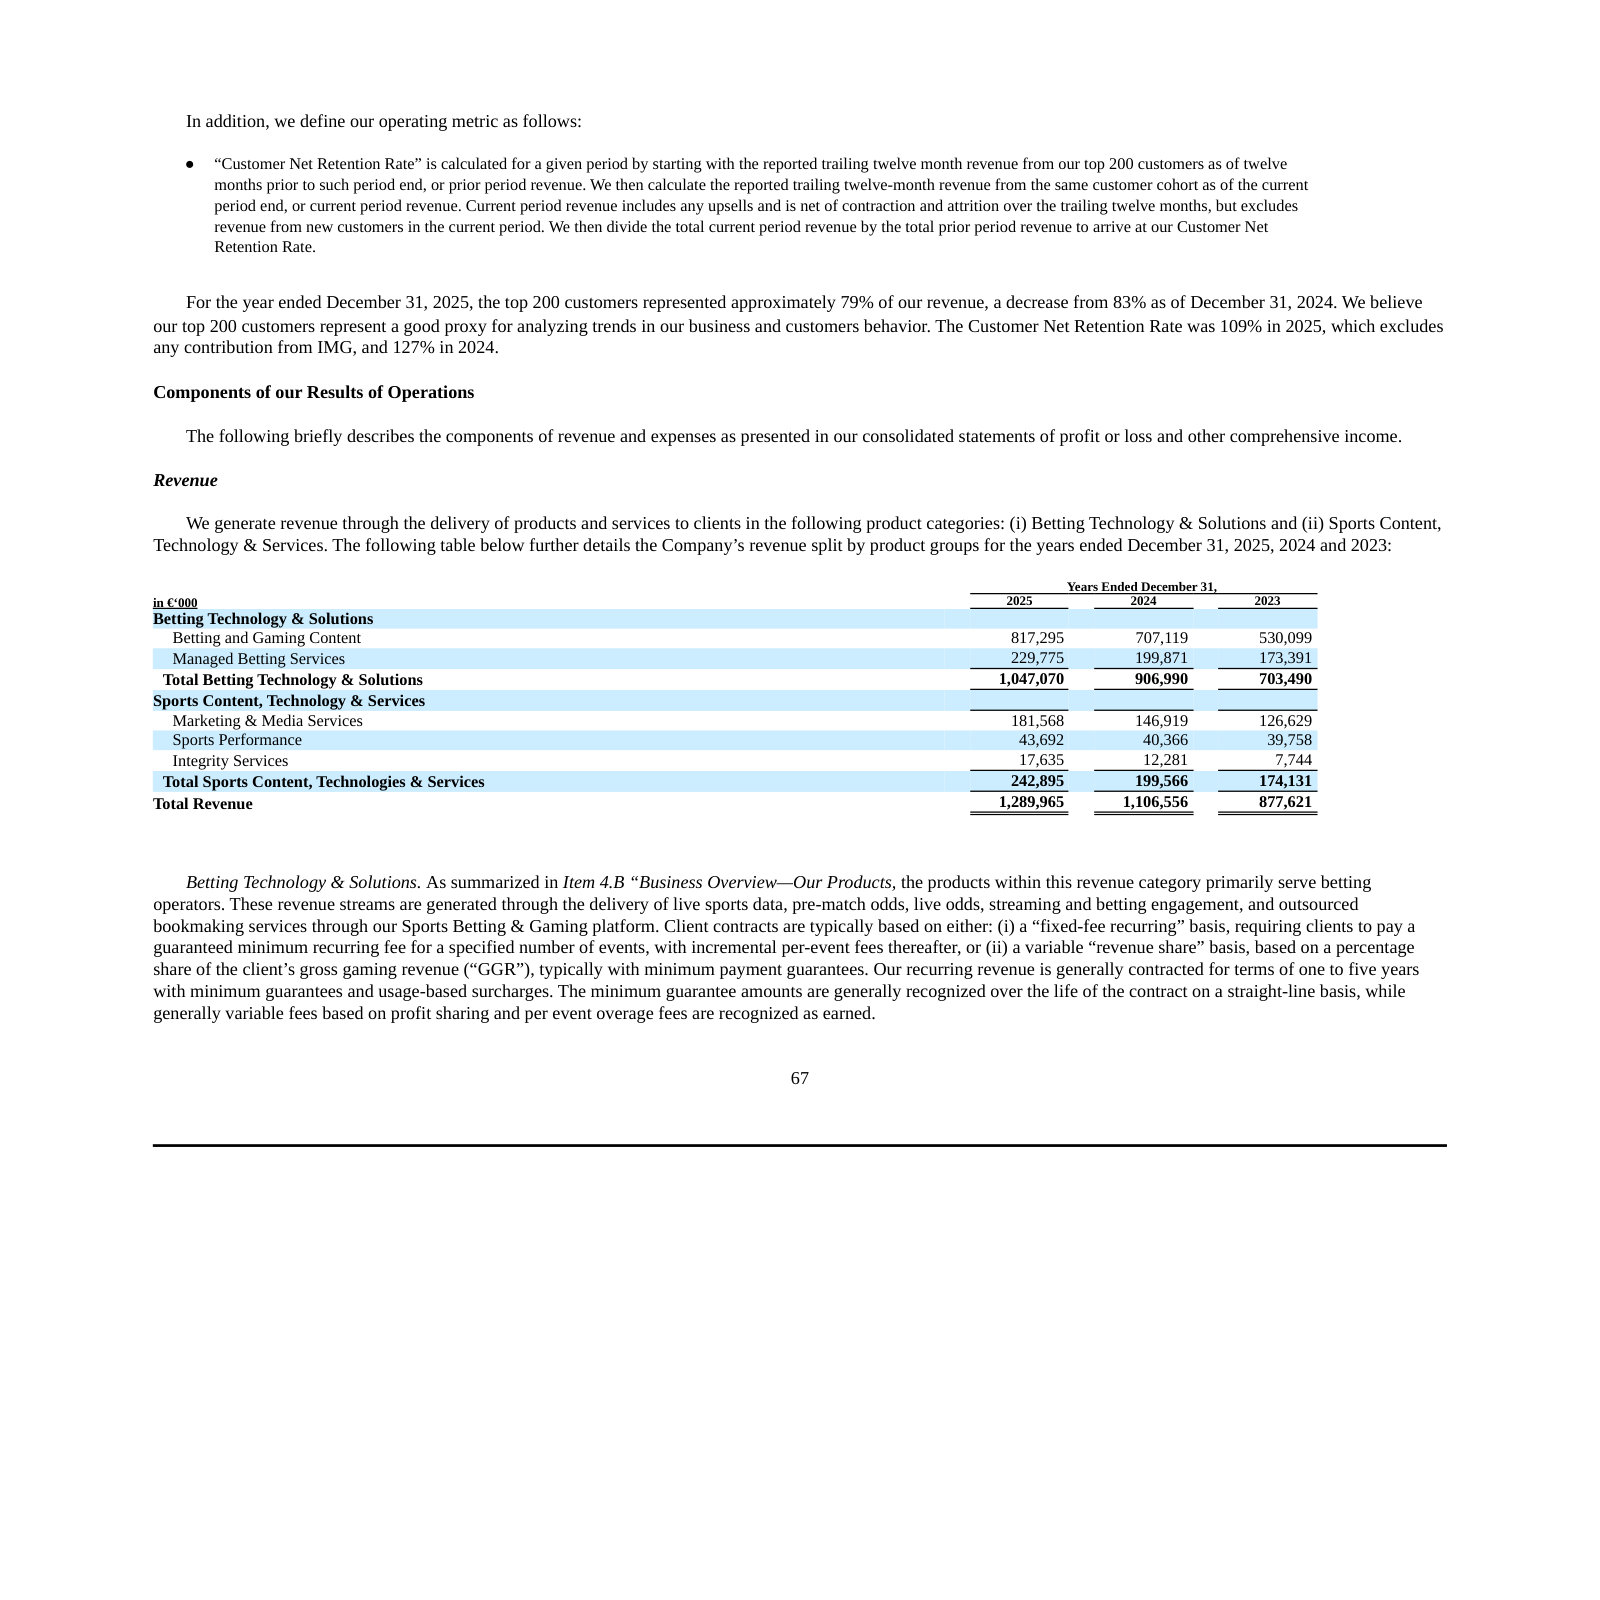
The two contract forms behind Betting Technology & Solutions revenue.
Client contracts are typically based on either: (i) a “fixed-fee recurring” basis, requiring clients to pay a guaranteed minimum recurring fee for a specified number of events, with incremental per-event fees thereafter, or (ii) a variable “revenue share” basis, based on a percentage share of the client’s gross gaming revenue (“GGR”), typically with minimum payment guarantees. Our recurring revenue is generally contracted for terms of one to five years with minimum guarantees and usage-based surcharges. The minimum guarantee amounts are generally recognized over the life of the contract on a straight-line basis, while generally variable fees based on profit sharing and per event overage fees are recognized as earned.
p. 71 · Read in context →
Comparison of Results for the Fiscal Years Ended December 31, 2025 and 2024 — p. 73 · Read the full section →
Where profit tripled: a €117m swing in FX on dollar sport-rights payables sits alongside 17% revenue growth.
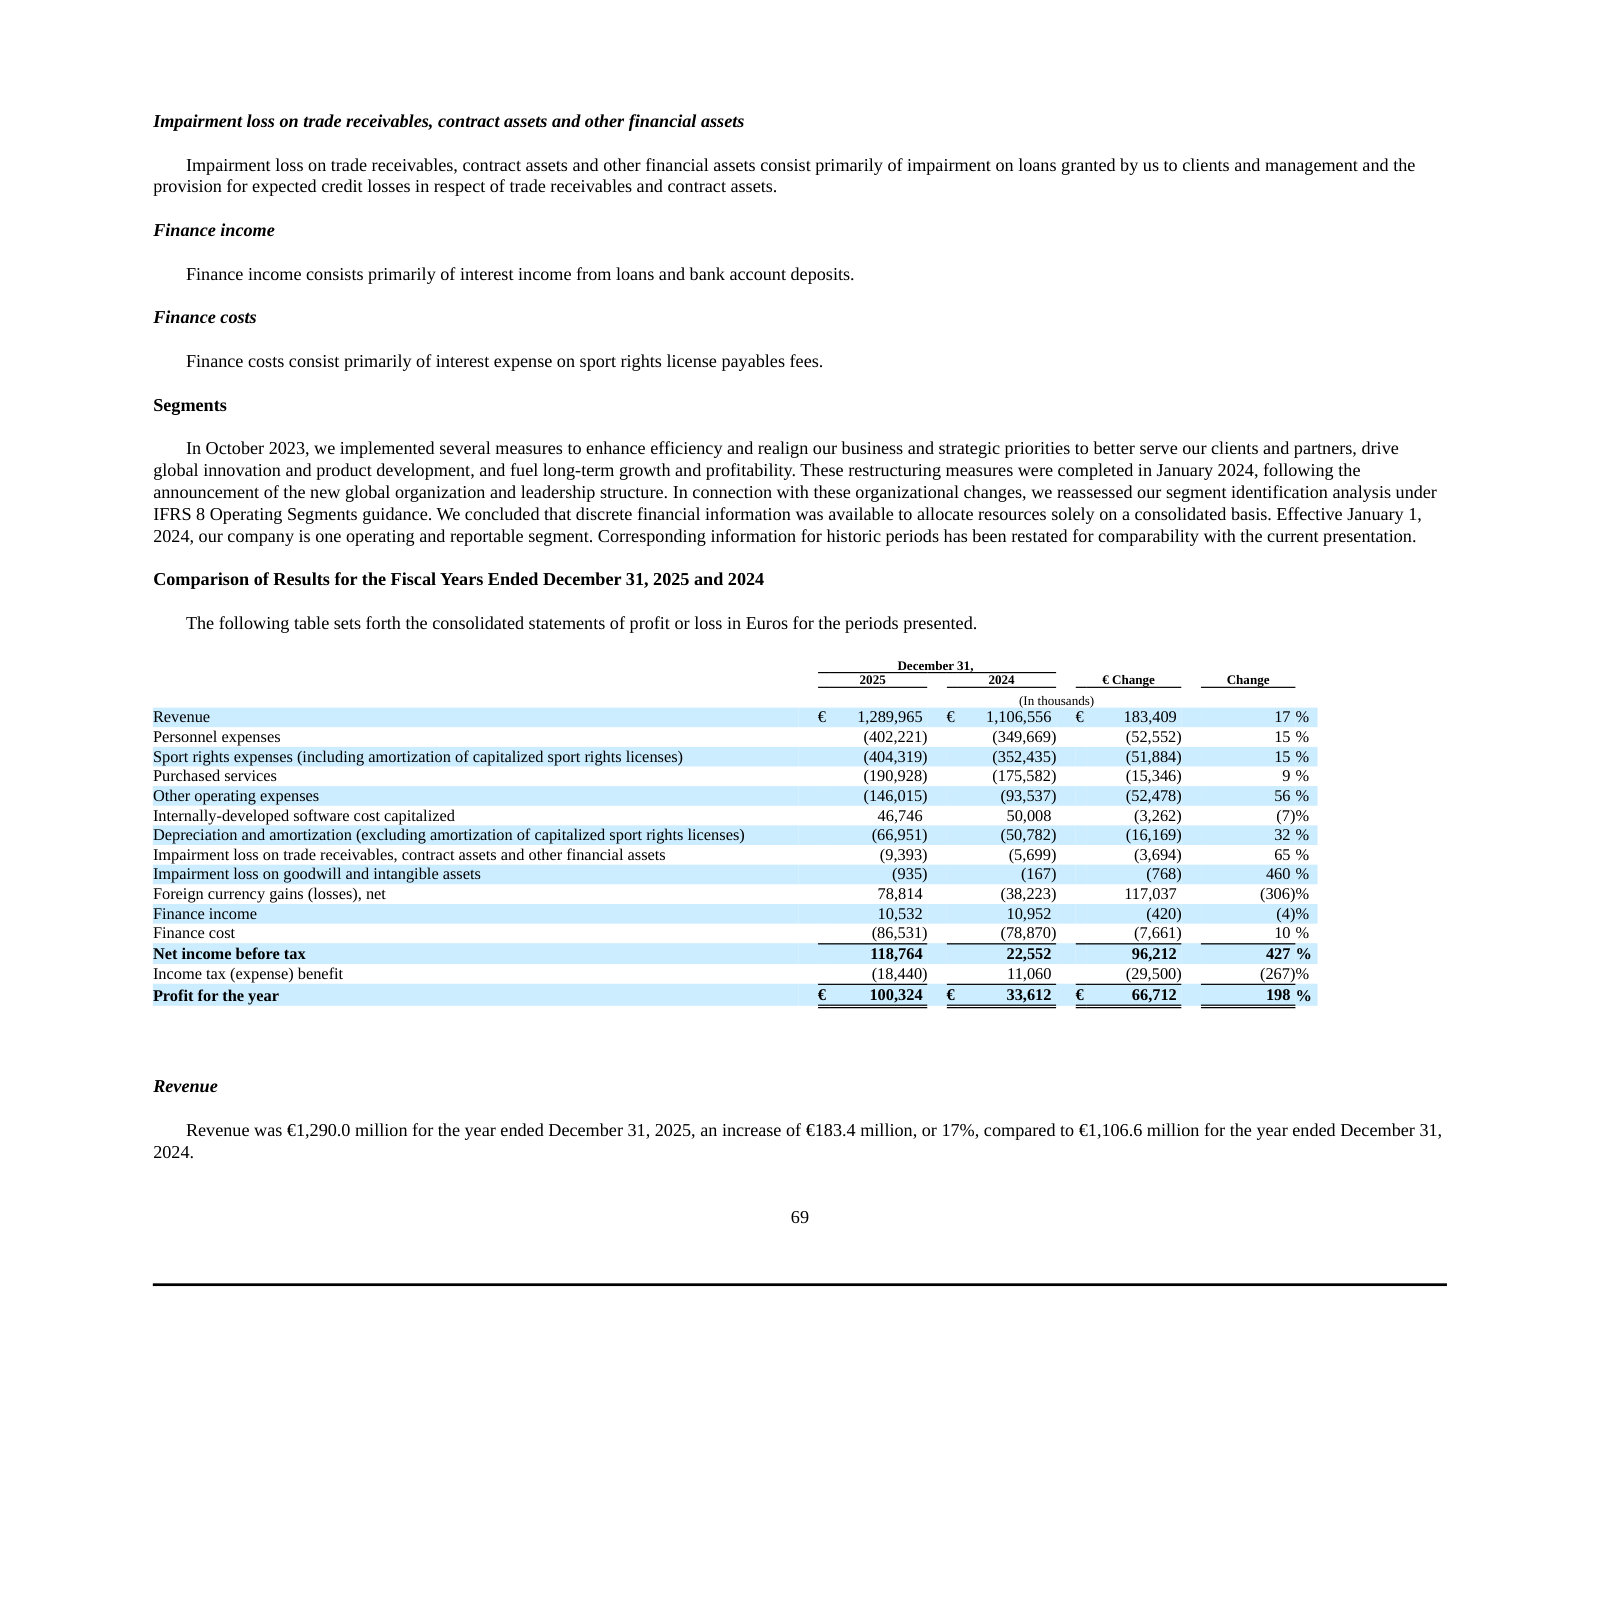
Management's attribution of the revenue increase by product group.
Betting Technology & Solutions revenues of €1,047.1 million were up 15% year-over-year primarily driven by a 16% increase in Betting and Gaming Content due to customer uptake of our content and products, contributions related to the acquisition of IMG ARENA, as well as from U.S. market growth, partially offset by the impact of foreign currency movements. Managed Betting Services revenues of €229.8 million were up 15% driven by strong growth in Managed Trading Services due to higher turnover and new clients. […] Sports Content, Technology & Services revenues of €242.9 million increased 22% year-over-year primarily driven by a 24% increase in Marketing & Media Services due to increased spending from technology and media customers and contributions related to our expanded affiliate marketing capabilities.
p. 74 · Read in context →
Item 15. Controls and Procedures — p. 107 · Read the full section →
A second straight year of ineffective internal control, and an adverse ICFR opinion from KPMG alongside a clean audit opinion.
Note 2.3 Use of judgments, estimates and assumptions — a) Newly acquired or modified sport rights licenses — p. 131 · Read the full section →
Whether a league deal becomes a €1.5bn intangible or an expense turns on IAS 38 judgment; KPMG calls it a critical audit matter.
Sportradar Group AG — FY2023 Annual Report (Form 20-F) — FY2023
Included for one section only: the last segment disclosure before the January 2024 collapse to a single reportable segment. · Open the full document →
Note 5. Segmental information — p. 163 · Read the full section →
The last edition to report by segment: from January 1, 2024 Sportradar reports as one segment, so this split is never repeated.
The three reportable segments as defined before the 2024 consolidation.
During the years ended December 31, 2023, 2022 and 2021, the Company has the following divisions which are its reportable segments. These divisions offer different services and are managed separately by region
p. 163 · Read in context →
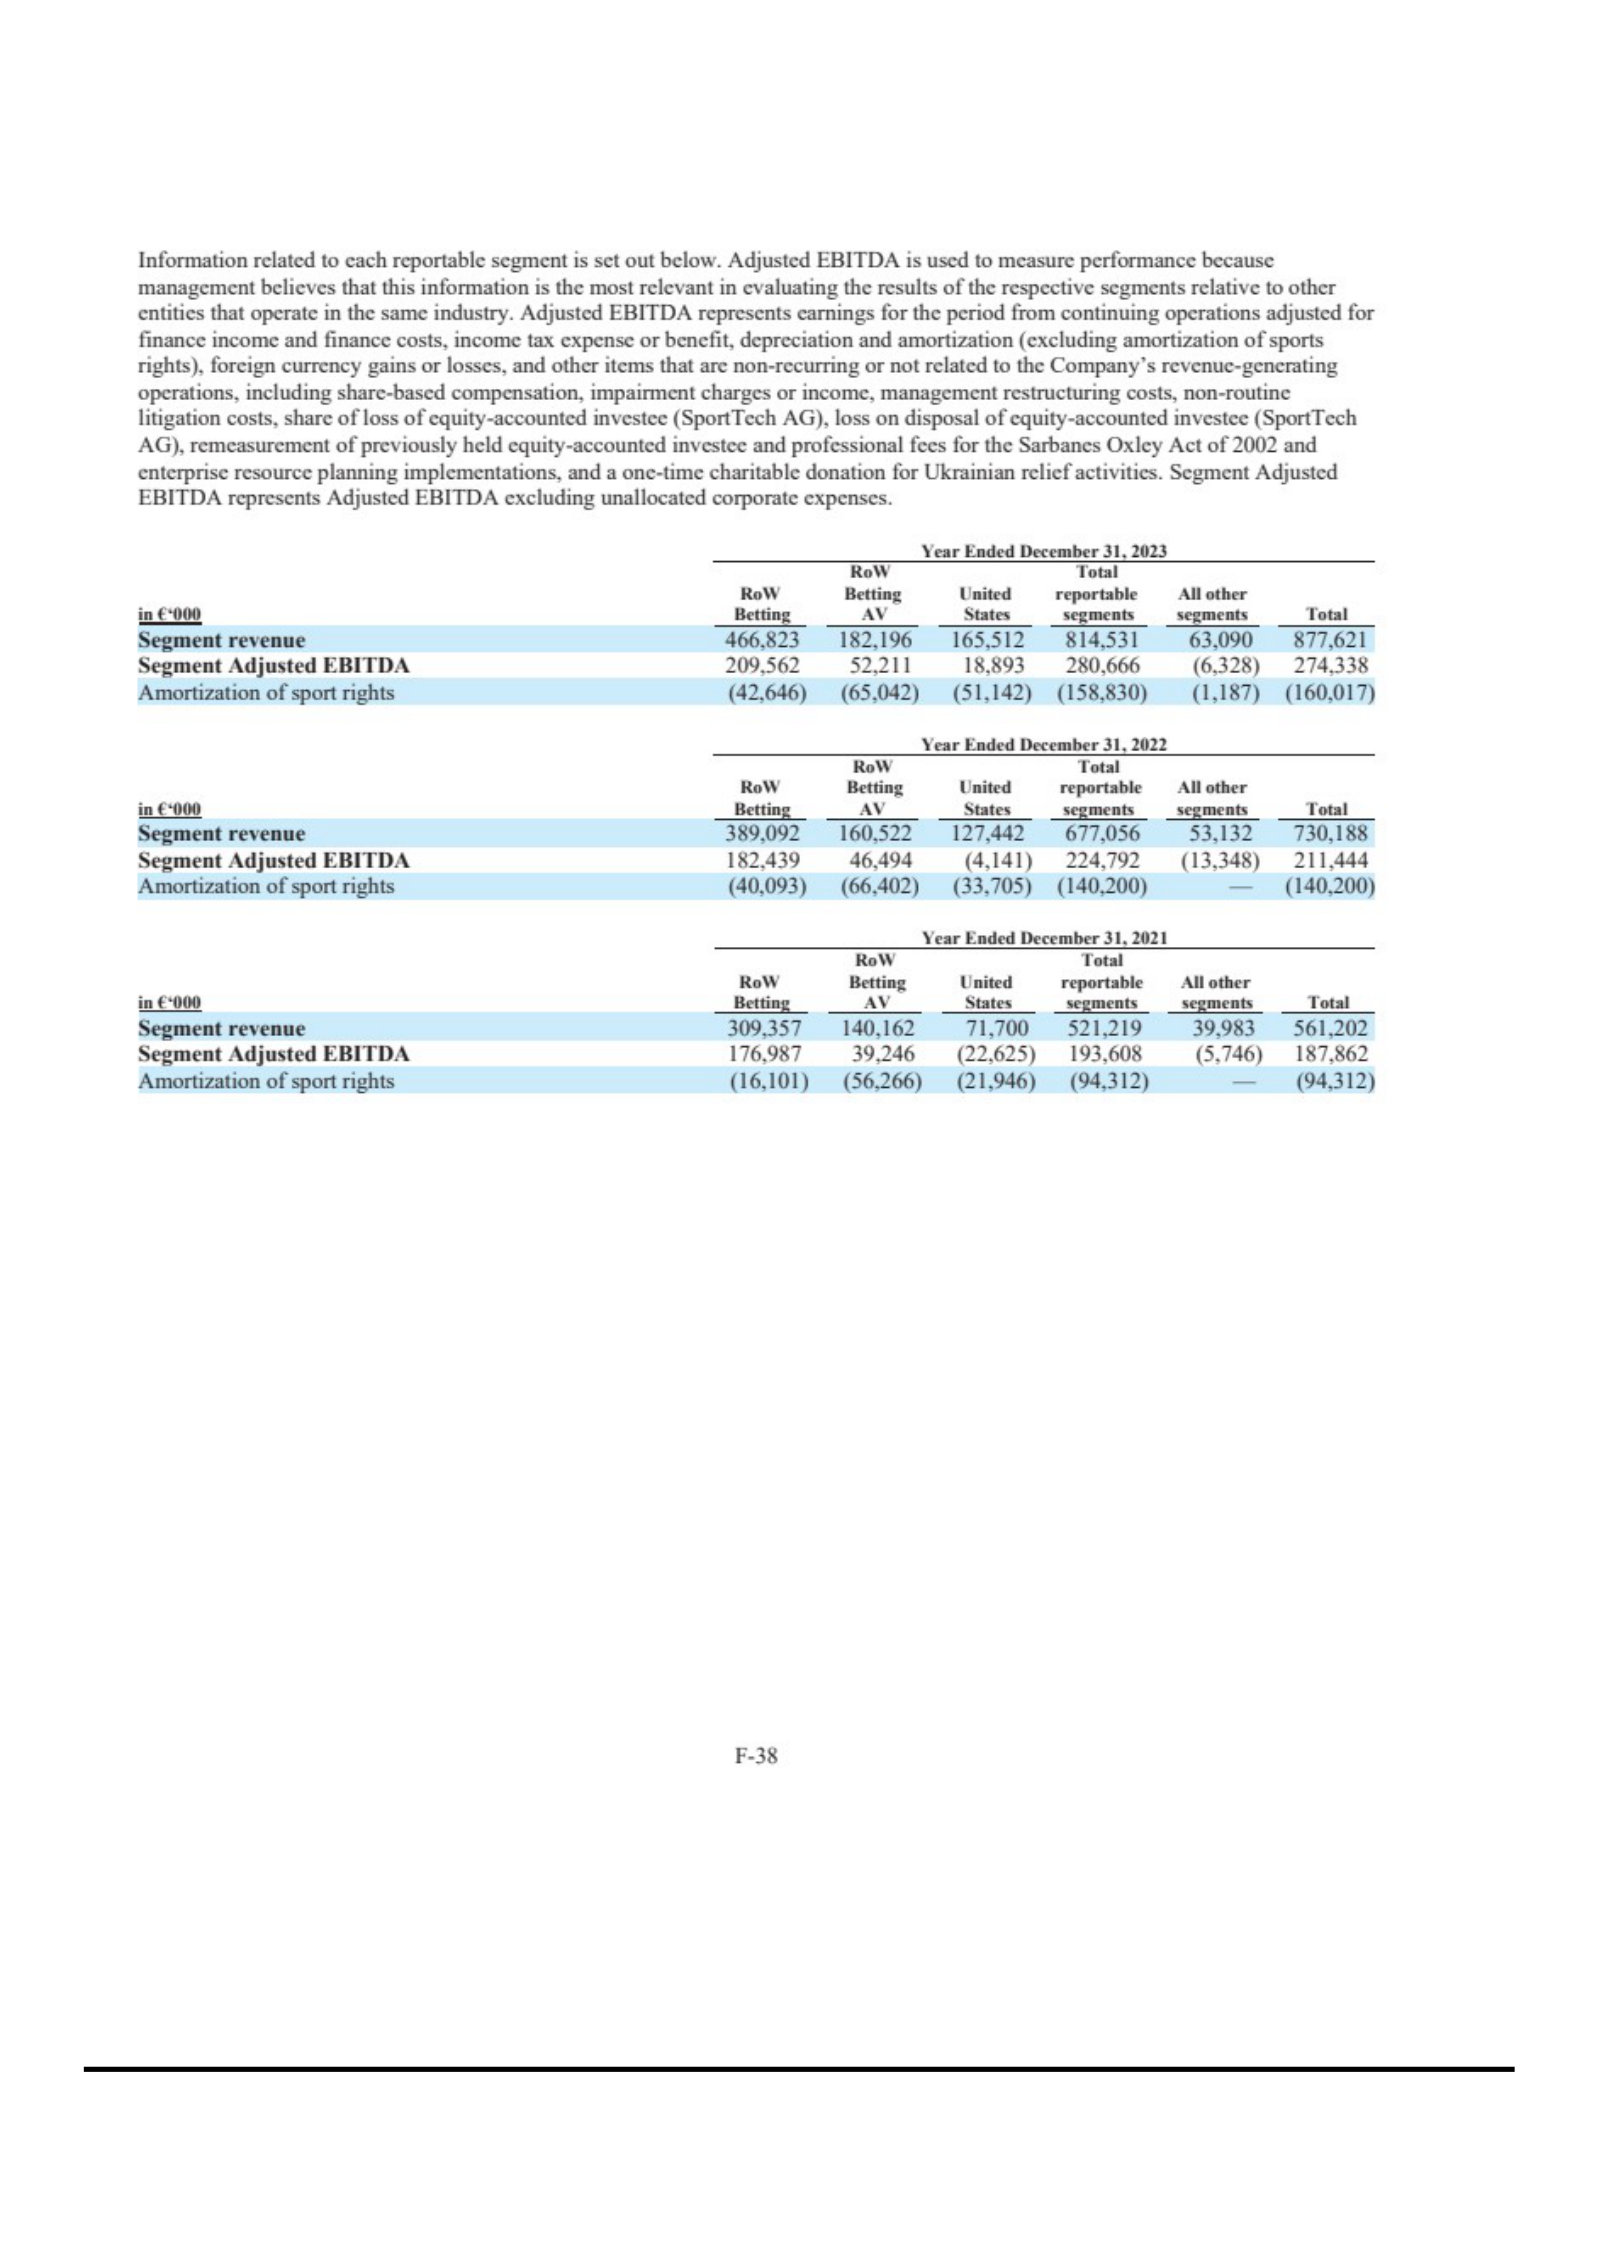
More annual reports
Sportradar Group AG — FY2024 Annual Report (Form 20-F) — FY2024 · 183 pages · Where the material weakness was first reported, and the first year presented on a single-segment basis. · Open →
Sportradar Group AG — FY2022 Annual Report (Form 20-F) — FY2022 · 205 pages · €730m revenue year on the old three-segment basis, before the 2023 restructuring. · Open →
Sportradar Group AG — FY2021 Annual Report (Form 20-F) — FY2021 · 213 pages · First annual report after the September 2021 Nasdaq listing; the baseline description of the platform. · Open →
Competitors describe Sportradar Group AG's market in their own filings and calls. These verified passages and visual pages show where their strategies meet, using source documents preserved in Sources.
Genius Sports (GENI)
Sportradar's closest head-to-head competitor and the only peer that collides with it across the whole stack: exclusive official league data rights, in-play betting feeds sold to sportsbooks, betting-integrated live streaming (BetVision vs. Sportradar's streaming/visualisation), automated computer-vision data capture, and sports advertising technology sold to brands and agencies (vs. Sportradar's ad:s marketing and media services). Both are also chasing the same emerging prediction-market data demand.
Genius Sports' stated sportsbook-customer footprint and retention — circa 500 licensed brands and 120–130% net revenue retention — the scale claim it puts against other B2B betting-data suppliers.
Mark Locke, Chief Executive Officer: Net revenue retention remains in the 120% to 130% range across our Sportsbook customers year after year. We partner with circa 500 licensed Sportsbook brands across regulated markets globally
p. 6 · Read in context →
Genius Sports' stated view that manual, human-keyed data collection is obsolete and that it is taking share as leagues move to automated capture — a direct claim against the operating model both firms have historically run on.
Mark Locke, Chief Executive Officer: Legacy manual data capture, where humans key in events from television feeds is obsolete. Leagues are transitioning towards automated AI-driven solutions, and we are winning that transition. […] We see a meaningful opportunity to take market share and drive incremental revenue with limited additional costs as more leagues make this transition.
p. 9 · Read in context →
Genius Sports' stated distribution gain for its betting-integrated streaming product (6 to over 100 sportsbooks in a year) and its claim to be growing betting revenue at roughly twice the rate of U.S. gross gaming revenue.
Mark Locke, Chief Executive Officer: This time last year, we had 6 Sportsbook customers integrated with BetVision. As of today, that number has grown to over 100 Sportsbooks, representing more than 350 brands. […] And as we have proven consistently, our Betting revenue growth continues to exceed the growth of the overall market. This was the case again in Q3 with the growth of our Betting revenue nearly doubling the growth of our U.S. GGR.
p. 7 · Read in context →
Kambi Group (KAMBI)
A B2B sportsbook supplier that is both a Sportradar data customer and a competitor. Its unbundling into modular services — Odds Feed+ pricing, managed trading and risk, bet builder, esports data via Abios — puts it directly against Sportradar's Managed Trading Services, odds feeds and betting-platform products, and its AI trading programme targets the same automation ground. Kambi's CEO Werner Becher ran Sportradar's US betting arm and then its EMEA/LatAm business before joining in 2024.
Kambi's sizing of the European online betting market (third-party VIXIO forecast of over €20bn online GGR by 2028) and its statement that growth in mature Europe now has to come from taking business off rival suppliers.
2025 Annual Report — Sports betting market, Europe: Europe remains a cornerstone of the global sports betting industry, projected by VIXIO GamblingCompliance to exceed €20 billion in online gross gaming revenue by 2028. It is the most mature region for sports betting globally – meaning fewer new market opportunities and placing the emphasis on winning business from competitor suppliers, an aspect in which Kambi has performed well throughout 2025.
p. 18 · Read in context →
Kambi's named wins for Odds Feed+ and its stated intent to extend from pricing into bet acceptance and risk management — the standalone odds-and-trading ground Sportradar sells into.
2025 Annual Report — Strategic framework: A clear example of this strategy in action is Odds Feed+, Kambi's premium pricing service powered by the Group's significant sports betting liquidity pool. During the year Odds Feed+ established itself as a trusted trading tool for a growing number of leading operators, including FDJ UNITED, Hard Rock Digital, LeoVegas, Superbet and Rei do Pitaco. […] In addition to delivering precise and competitive pricing, Kambi sees opportunities to extend the product's scope across the bet lifecycle, including greater influence over bet acceptance and risk management. This evolution would further grow Kambi's role as a critical trading partner, rather than solely a price provider.
p. 12 · Read in context →
Kambi's characterisation of rival suppliers as still dependent on manual trading and therefore having to cut back their offering after the World Cup — its claim to a structural cost and coverage edge in odds compilation and risk management.
Werner Becher, Chief Executive Officer: With our offering now automated, others still reliant on manual trading will need to scale back down now […] We will not have this need to scale anything down.
p. 5 · Read in context →
Better Collective (BETCO)
The collision is with Sportradar's Marketing & Media Services (ad:s) rather than its data business: Better Collective monetises owned sports audiences and first-party data to acquire and retarget bettors for sportsbooks, through affiliation, paid media and its AdVantage/FanReach adtech stack. It is the same buyer, the same operator marketing budget, and — as Genius Sports' Legend acquisition shows — the same audience-plus-intent layer both data suppliers are moving toward.
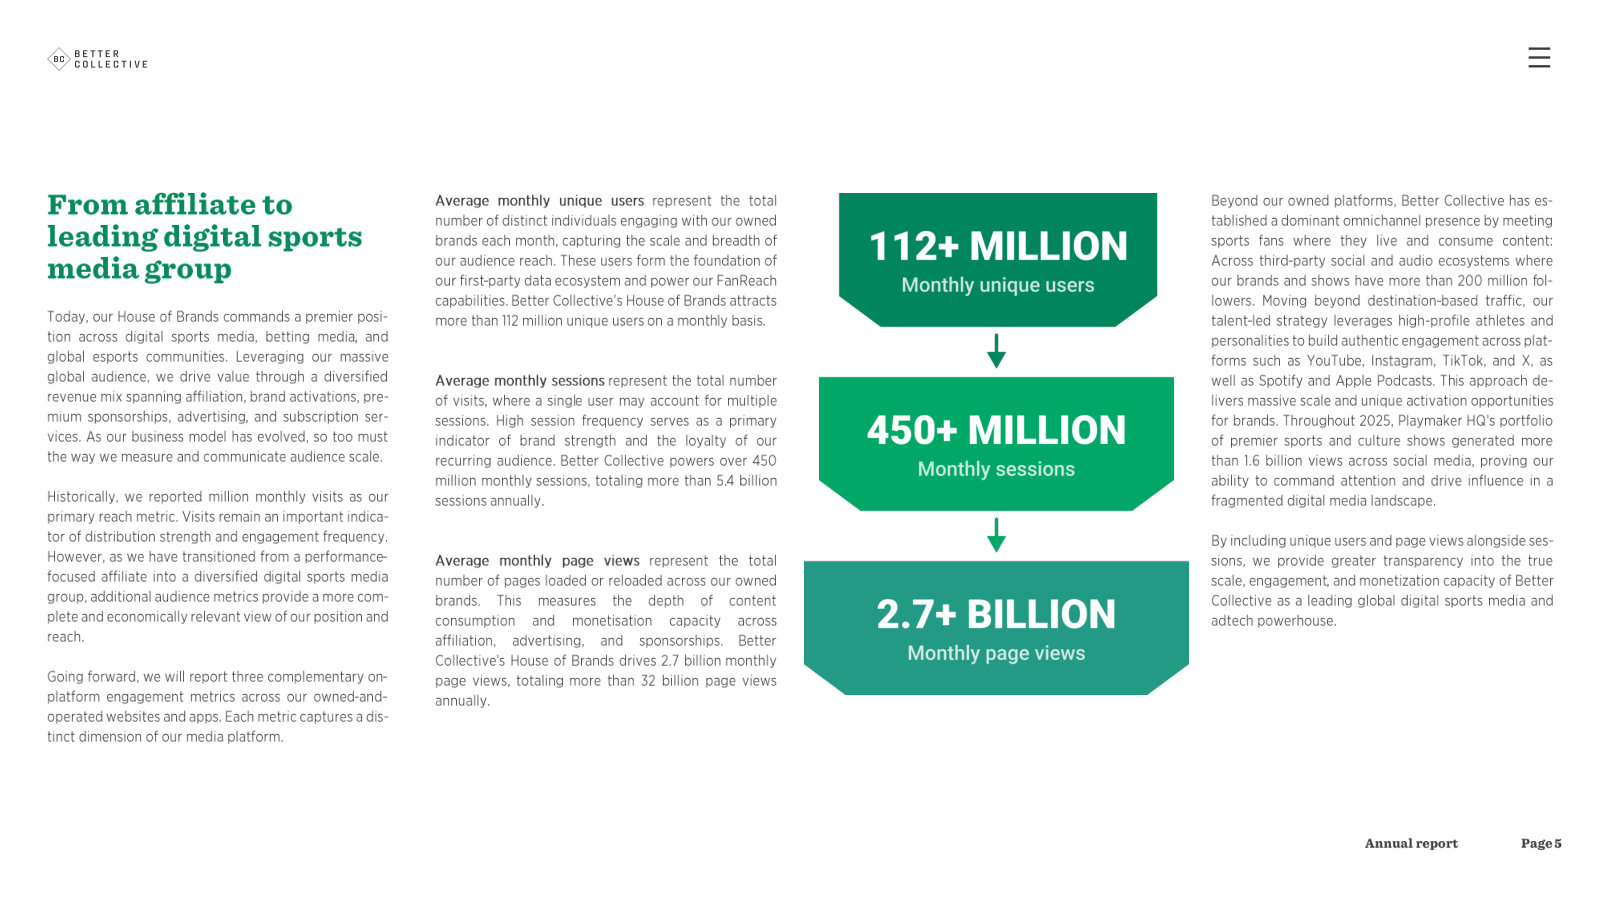
How Better Collective defines its own market and revenue model — performance-based sports betting affiliation plus advertising and paid media — the operator acquisition-marketing spend Sportradar's ad:s business also competes for.
2025 Annual Report — We are a global digital sports media group: At the intersection of sports media and sports betting, connecting highly engaged audiences with leading sportsbooks and brands through our trusted brands and products. […] We build scalable sports media brands, products, and platforms, combining content technology, and performance marketing to engage and retain valuable audiences. […] Primarily driven by sports betting affiliation through performance-based revenue share models, complemented by advertising, subscriptions, paid media, and partnerships
p. 6 · Read in context →
Better Collective's stated read on prediction markets as an addressable-market expansion rather than a threat — the same conclusion Genius Sports and Sportradar's other peers reached in the 2025–26 reporting cycle.
2025 Annual Report — Co-CEO & Chair Letter: Prediction markets introduce a new product format and attract incremental user segments, while overlapping meaningfully with our existing sports and sports betting audience. […] Our scalable publishing network and paid media capabilities enable us to work seamlessly with all relevant players in the ecosystem.
p. 11 · Read in context →
BetMakers Technology Group (BET)
The narrowest but most literal overlap: a B2B supplier of racing data, form and content, fixed-odds pricing and race streaming to wagering operators — the horse-racing content and pricing niche within Sportradar's betting-services portfolio. Its customer list (bet365, PA Betting Services, GiG, PMU) is drawn from the same operator base, and it sells its pricing product into Kambi's sportsbook. Featured on racing/wagering technology only; its Global Tote business is out of scope.
BetMakers' self-description of its B2B racing and betting technology footprint — the racing data, content and pricing layer that overlaps Sportradar's racing offering.
FY2024 Annual Report — Racing Enhanced: BetMakers Technology Group (ASX:BET) is a leading international provider of B2B technology products with a global footprint that spans the world's major racing and betting markets. Our technology and service solutions enhance betting on racing at critical points along the life cycle for fixed odds and pari-mutuel wagering, unlocking new revenue streams, expanding markets, and enhancing user experience.
p. 5 · Read in context →
BetMakers' stated FY2024 deal list — race streaming, racing content distribution and a fixed-odds pricing product sold into another Sportradar peer's sportsbook — showing where its wins land in the same operator base.
Jake Henson, Chief Executive Officer: In FY24 we were pleased to enter into a new arrangement with PA Betting Services to launch The AdVantage Platform, a turn-key B2B race streaming and wagering platform for wagering operators. We also signed market access and content agreements with bet365 relating to the US states of New Jersey and Colorado, a new contract to deliver racebook services on GiG's sportsbook platform SportX, a new contract to deliver our newly revamped Price Manager fixed odds solution to Kambi's sportsbook […]
p. 8 · Read in context →
More peer documents
Q4_FY2025 — 26 pages · Genius Sports sizes the market it shares with Sportradar — claiming to outpace 24% growth in global online sports betting GGR — and lays out the Legend acquisition thesis for owning audience and intent alongside official data. · Open →
Q1_FY2026 — 14 pages · Kambi discloses an esports data-provision agreement with Google via its Abios division, citing its own computer vision, data collection and distribution capability — Sportradar's core competence, in a peer's hands. · Open →
KAMBI_annual_report_FY2024 — 101 pages · Prior-year framing of the same modular strategy (Odds Feed+, Managed Trading, Bet Builder, Esports) for a year-over-year read on TAM expansion; also carries the CEO biography describing his years running Sportradar's US and EMEA/LatAm businesses. · Open →
Q4_FY2025 — 13 pages · Full-year results with 2026 guidance bridge, the Kindred turnkey-to-Odds Feed+ transition, and a competitor-switch win (Pickwin in Mexico) — useful for reading B2B supplier churn. · Open →
Q3_FY2025 — 14 pages · Twelve commercial agreements in a quarter including tier-one Odds Feed+ signings, plus the player account management source-code acquisition aimed at markets such as Nevada. · Open →
BETCO_annual_report_FY2024 — 181 pages · Prior-year Better Collective report for the pre-rebasing baseline on audience, Brazil and the North American revenue-share shift that underpins its 2025 competitive-position claims. · Open →
Source: S&P Capital IQ consensus via Xpressfeed · Generated 2026-07-28.
The consensus tape has turned. Revenue surprises decayed from +7.2% in Q3 2024 to -4.2% in Q1 2026, the largest miss in the visible record, and the FY2027 normalized-EPS consensus has been cut to EUR 0.69 from EUR 0.75 thirty days ago against a revenue line that barely moved. The forward shape still embeds heavy compounding, with revenue growth stepping down from about +21% in FY2026 to about +10% in FY2029 while EBITDA and free cash flow grow faster than revenue in every visible year. Coverage does the rest of the talking: 21 analysts on FY2027 revenue, 3 on normalized EPS, and 2 on all of FY2029.
Revenue surprises decayed from +7.2% to -4.2%, with three straight misses
Current sequences by metric: Revenue: 3 consecutive misses; EPS (normalized): 1 consecutive miss.
Currency: EUR · Scale: money in millions, absolute · Consensus is captured before each actual first became effective.
| Quarter | Metric | Consensus | Actual | Surprise | Outcome |
|---|---|---|---|---|---|
| Q1 FY2026 | Revenue | €361.66m | €346.52m | -4.2% | Miss |
| Q1 FY2026 | EPS (normalized) | €0.05 | -€0.01 | -118.8% | Miss |
| Q4 FY2025 | Revenue | €369.58m | €368.89m | -0.2% | Miss |
| Q4 FY2025 | EPS (normalized) | €0.10 | €0.20 | +112.2% | Beat |
| Q3 FY2025 | Revenue | €294.86m | €292.05m | -1.0% | Miss |
| Q3 FY2025 | EPS (normalized) | €0.07 | €0.12 | +60.0% | Beat |
| Q2 FY2025 | Revenue | €315.48m | €317.79m | +0.7% | Beat |
| Q2 FY2025 | EPS (normalized) | €0.03 | €0.01 | -65.7% | Miss |
| Q1 FY2025 | Revenue | €307.39m | €311.23m | +1.3% | Beat |
| Q1 FY2025 | EPS (normalized) | €0.05 | €0.01 | -72.7% | Miss |
| Q4 FY2024 | Revenue | €294.60m | €307.07m | +4.2% | Beat |
| Q4 FY2024 | EPS (normalized) | €0.04 | €0.01 | -81.9% | Miss |
| Q3 FY2024 | Revenue | €237.95m | €255.17m | +7.2% | Beat |
| Q3 FY2024 | EPS (normalized) | €0.03 | €0.08 | +160.5% | Beat |
| Q2 FY2024 | Revenue | €263.39m | €278.42m | +5.7% | Beat |
| Q2 FY2024 | EPS (normalized) | €0.05 | €0.00 | -91.0% | Miss |
Estimate momentum
The EPS cut is recent rather than gradual: the number was higher 30 days ago than it was 90 days ago before dropping to EUR 0.69. FY2028 revenue tells a similar story one year out, sitting about 4% below its 180-day-ago level though it has firmed about 1% in the past month.
Currency: EUR · Scale: money in millions, absolute · Point-in-time consensus; Δ90d is Now versus 90d.
| Metric | FY | 180d | 90d | 30d | Now | Δ90d |
|---|---|---|---|---|---|---|
| EPS (normalized) | FY2027 | €0.74 | €0.72 | €0.75 | €0.69 | -4.8% |
| Revenue | FY2027 | €1.81bn | €1.80bn | €1.78bn | €1.78bn | -1.3% |
Revenue growth steps down from +21% to +10% while EBITDA and FCF outpace it
EBITDA and free cash flow are modelled to grow faster than revenue in every year through FY2029. Coverage falls away as the years go out, from 21 analysts on FY2027 revenue to 13 on FY2028 and 2 on FY2029.
Currency: EUR · Scale: money in millions, absolute · YoY uses the prior fiscal year from the feed; analyst count and range use the first displayed period.
| Metric | FY2026E | FY2027E | FY2028E | FY2029E | YoY | Analysts | Low / high |
|---|---|---|---|---|---|---|---|
| Revenue | €1.56bn | €1.78bn | €1.98bn | €2.18bn | +20.6% | 21 | €1.52bn / €1.56bn |
| EBITDA | €390.65m | €482.97m | €563.57m | €671.45m | +31.6% | 21 | €362.59m / €400.15m |
| Free cash flow | €227.00m | €296.84m | €375.50m | €492.50m | +27.1% | — | — |
Revenue estimates cluster within 8%; the FY2027 EPS high is double the low
FY2027 GAAP EPS runs from EUR 0.45 to EUR 0.93 across 18 analysts, and FY2027 net income from EUR 141.1m to EUR 270.7m across 15. The argument is about what falls through to earnings, not about how much revenue arrives.
Currency: EUR · Scale: money in millions, absolute · Spread/mean is absolute high-low divided by absolute mean.
| Metric | Period | Mean | Low–high | Spread/mean | Analysts |
|---|---|---|---|---|---|
| EPS (GAAP) | FY2027E | €0.66 | €0.45–€0.93 | 73.3% | 18 |
| Net income (GAAP) | FY2027E | €192.65m | €141.10m–€270.70m | 67.3% | 15 |
| Net income (GAAP) | FY2028E | €257.98m | €212.76m–€319.60m | 41.4% | 10 |
| EBITDA | FY2027E | €482.97m | €439.55m–€506.97m | 14.0% | 21 |
| Revenue | FY2028E | €1.98bn | €1.92bn–€2.06bn | 7.5% | 13 |
22 targets span EUR 13.11 to EUR 30.69, and no analyst carries a sell
Sixteen buys and two outperforms stand against four holds, with no sell or underperform ratings. The mean target of EUR 18.59 sits above the median of EUR 17.24, so the average is pulled up by the top of the range; this source carries no share price, so no upside is computed here.
Currency: EUR · Scale: money in millions, absolute · Analyst counts shown explicitly.
| Street view | Reading | Analysts |
|---|---|---|
| Recommendation mix | Buy 16, Outperform 2, Hold 4, Underperform 0, Sell 0 | 22 |
| Consensus score | 1.45 | 22 |
| Target price | mean €18.59; median €17.24; high €30.69; low €13.11 | 22 |
Normalized EPS rests on three analysts, and FY2029 on two
Normalized EPS carries just three estimates in every annual period it covers, against 18 on FY2027 GAAP EPS, so the revision signal above rests on a narrow panel. FY2029 revenue, EBITDA and EPS each rest on two estimates, and the mean gross margin falls from 75.6% in FY2027 to 65.7% in FY2028 and 61.3% in FY2029 as the contributing panel thins.
Visible Alpha broker models via S&P Xpressfeed · 18 brokers · 337 line items · freshest revision 2026-07-23.
Sportradar's models are near-unanimous on revenue and wide open below it: 18 brokers cluster on FY-2026 revenue, then spread FY-2027 net income from €99.8m to €270.7m. The shared story is a margin bend — EBITDA margin 22.6% in FY-2025 to 28.6% in FY-2028 — bought by sport rights expense growth decelerating faster than revenue. Betting gaming content supplies most of the incremental top line, while sports performance and integrity services are small enough that the models barely move on them. Product-level detail rests on 9 to 11 brokers, and several of those lines have not been revised since 7 May 2026.
Margin, not growth, is the modelled story: EBITDA margin 22.6% to 28.6% as revenue growth halves
Rights expense growth falls below revenue growth from FY-2027, and that is where the margin expansion comes from. The Rule of 40 reading peaks in FY-2026 at 45.7 and slips thereafter, so the margin gain does not fully offset the growth fade.
| Line | FY-2025A | FY-2026E | FY-2027E | FY-2028E | YoY | Brokers |
|---|---|---|---|---|---|---|
| Growth | — | — | — | — | — | — |
| Total revenue | €1.29bn | €1.56bn | €1.77bn | €1.96bn | +20.5% | 18 |
| Cost driver | — | — | — | — | — | — |
| Sport rights expenses (including amortization of capitalized sport rights licenses) | €403.47m | €484.77m | €534.72m | €583.05m | +20.2% | 16 |
| Profit | — | — | — | — | — | — |
| EBITDA - Operating | €292.32m | €390.35m | €481.72m | €561.57m | +33.5% | 18 |
| EBITDA margin(%) | 22.6% | 25.1% | 27.2% | 28.6% | +2.4pt | 18 |
| Operating income/(loss) | €162.42m | €241.70m | €325.63m | €395.99m | +48.8% | 17 |
| Drop-through | — | — | — | — | — | — |
| Incremental margin(%) | 14.3% | 43.5% | 39.4% | 37.0% | +29.2pt | 16 |
| Rule of 40, Revenue growth + EBITDA margin(%) | 39.4% | 45.7% | 41.0% | 39.9% | +6.4pt | 18 |
| Cash | — | — | — | — | — | — |
| FCF margin(%) | 14.1% | 14.3% | 15.6% | 17.5% | +0.3pt | 16 |
Betting gaming content is the engine — +28% in FY-2026 and most of the incremental euro thereafter
The split between segments is stark: betting technology & solutions is modelled to grow several times faster than sports content, technology & services in FY-2026. Sports performance is the telling negative, modelled to shrink 2.7% in FY-2026 before a modest recovery. Integrity services grows fast off a base too small to matter to the group.
| Line | FY-2025A | FY-2026E | FY-2027E | FY-2028E | YoY | Brokers |
|---|---|---|---|---|---|---|
| Segment | — | — | — | — | — | — |
| Revenue - Betting technology & solutions | €1.04bn | €1.28bn | €1.46bn | €1.63bn | +23.6% | 16 |
| Revenue - Sports content, technology & services | €253.29m | €273.00m | €310.06m | €344.75m | +7.8% | 16 |
| Product | — | — | — | — | — | — |
| Revenue - Betting gaming content | €802.48m | €1.03bn | €1.18bn | €1.31bn | +28.3% | 11 |
| Revenue - Managed betting services | €237.52m | €256.30m | €288.81m | €326.32m | +7.9% | 11 |
| Revenue - Marketing media services | €186.11m | €204.48m | €233.53m | €264.95m | +9.9% | 11 |
| Revenue - Sports performance | €46.93m | €45.67m | €49.03m | €52.18m | -2.7% | 11 |
| Revenue - Integrity services | €19.12m | €23.34m | €26.77m | €30.85m | +22.1% | 11 |
Quarterly path
EBITDA margin runs 19.6% in 1QFY-2026 against 30.8% in 3QFY-2026. Modelled 1QFY-2027 and 2QFY-2027 margins fall back to 22.5% and 22.8%, so annual margin expansion is back-half weighted rather than steady through the year.
| Line | 3QFY-2025A | 4QFY-2025A | 1QFY-2026A | 2QFY-2026A | 3QFY-2026E | 4QFY-2026E | 1QFY-2027E | 2QFY-2027E | Brokers |
|---|---|---|---|---|---|---|---|---|---|
| Revenue - Betting technology & solutions | €240.97m | €296.84m | €291.97m | €315.35m | €307.59m | €372.87m | €330.02m | €358.33m | 16 |
| Sport rights expenses (including amortization of capitalized sport rights licenses) | €72.07m | €120.70m | €122.80m | €128.89m | €92.57m | €141.02m | €134.26m | €140.48m | 16 |
| EBITDA - Operating | €78.20m | €85.40m | €71.03m | €79.40m | €116.82m | €128.18m | €89.76m | €98.84m | 17 |
| EBITDA margin(%) | 26.5% | 23.0% | 19.6% | 20.7% | 30.8% | 28.6% | 22.5% | 22.8% | 17 |
Where broker models disagree
| Line | Period | Median | Q1–Q3 | Min–max | Brokers |
|---|---|---|---|---|---|
| Net income/(loss) | FY-2027E | €186.10m | €159.76m–€203.14m | €99.82m–€270.71m | 17 |
| Non-capitalized sport right expenses | FY-2027E | €172.74m | €170.12m–€196.46m | €142.98m–€205.83m | 10 |
| Incremental margin(%) | FY-2027E | 40.5% | 35.3%–42.6% | 29.5%–52.0% | 16 |
| Free cash flow (FCF) | FY-2027E | €285.03m | €273.20m–€302.51m | €166.40m–€321.82m | 15 |
| Revenue - Managed betting services | FY-2027E | €287.73m | €274.62m–€303.23m | €254.21m–€318.92m | 10 |
Product splits carry May revision dates; segment EBITDA rests on one broker
Marketing media services, sports performance, integrity services and the sports content, technology & services segment were last revised 7 May 2026, while total revenue and EBITDA carry 23 July 2026. The segment-level EBITDA lines in this feed rest on a single broker and are one analyst's view rather than consensus, so they are excluded above.
Headline P&L consensus, momentum and beat/miss live in the CapIQ tab.
Source: S&P Capital IQ transcripts via Xpressfeed · latest indexed call 2026-04-28 · generated 2026-07-28.
Latest call digest
Sportradar Group AG, Q1 2026 Earnings Call, Apr 28, 2026 · 2026-04-28T12:00:00
Q1 2026 — call held April 28, 2026. Sportradar moved the call a week earlier than planned. Craig Felenstein said the reason was to get the results out so the company could better capitalize on the opportunity provided by the current share price. The prepared remarks opened not with the quarter but with Carsten Koerl's rebuttal of recent short-seller reports, a $250 million enhanced open market repurchase under the $1 billion authorization, Koerl's stated intention to buy $10 million of stock personally, and the appointment of Sameer Deen as COO effective May 18.
What management put forward. Revenue of 347 million, up 11% year over year and 16% on a constant currency basis; adjusted EBITDA of 66 million at a 19% margin; free cash flow conversion of 67% against 54% a year ago; more than 75% of core betting clients now consuming IMG content, with management saying it expects to exceed the 25% IMG revenue synergy target. Full-year 2026 guidance was reaffirmed at 23% to 25% constant currency revenue growth, $1.56 billion to $1.58 billion reported, adjusted EBITDA of $390 million to $400 million, and 200 to 225 basis points of margin expansion. New in the quarter: restructuring charges of $13 million to $18 million over the remainder of the year, an explicitly slower U.S. market, and prediction-market revenue built into the back half of the guide.
Where the Q&A diverged. Allegations, not the quarter, drove most of the questions. Management walked through a top-down bridge for gray-market exposure — the exposed product lines are in the mid-40% of revenue, less U.S. revenue, less large global operators — landing at a low to mid-single-digit share, with Koerl adding that an AI system run against public market data could put the figure at a maximum of 12%. The second pressure point was the credibility of an unchanged guide after a soft start: marketing services declined, MTS revenue was hit by player-friendly outcomes even with turnover up 24%, and FX cost roughly five points of reported growth. Felenstein declined to give a Q2 number and declined to normalize the MTS outcome effect. Prediction markets was the third: across several analysts the answer held steady — discussions are mature, nothing is signed, and anything announced in the short term is already inside the guide.
Participant coverage from the latest call.
| Group | Participants | Count |
|---|---|---|
| Management | Operator; James Bombassei — Senior Vice President of Investor Relations & Corporate Finance, Sportradar Group AG; Carsten Koerl — Founder, CEO & Director, Sportradar Group AG; Craig Felenstein — Chief Financial Officer, Sportradar Group AG | 4 |
| Analysts | Ryan Sigdahl — Partner & Senior Research Analyst of Institutional Research, Craig-Hallum Capital Group LLC, Research Division; Chad Beynon — MD, Head of US Research & Senior Gaming, Lodging and Theatres Analyst, Macquarie Research; Barry Jonas — MD & Senior Gaming Equity Analyst, Truist Securities, Inc., Research Division; Jeffrey Stantial — Director of Equity Research, Stifel, Nicolaus & Company, Incorporated, Research Division; Shaun Kelley — MD in Americas Equity Research & Research Analyst, BofA Securities, Research Division; Michael Hickey — Senior Equity Analyst, The Benchmark Company, LLC, Research Division; Raymond Bowers — Equity Analyst, Wells Fargo Securities, LLC, Research Division; Robin Farley — Managing Director and Research Analyst, UBS Investment Bank, Research Division; Samuel Nielsen — Analyst, JPMorgan Chase & Co, Research Division; William Lampen — Director and Digital Gaming Analyst, BTIG, LLC, Research Division | 10 |
Curated latest-call exchanges; one row per analyst topic.
| Analyst | Firm | Topic | What changed in Q&A |
|---|---|---|---|
| Ryan Sigdahl | Craig-Hallum | Marketing services decline and the reaffirmed guide | Asked what happened in marketing services and what supports an unchanged full-year guide after a softer start. Felenstein called the line historically choppy, cited operators pulling back and holding spend for the World Cup, and named three supports for the guide: marketing recovery, IMG uptake, and back-half prediction-market revenue. |
| Ryan Sigdahl | Craig-Hallum | Black-market and gray-market revenue exposure | Asked management to quantify revenue from operators in illegal markets. Koerl said the company does not work with black-market operators and works only with licensed operators, then handed to Felenstein for the revenue bridge down to a low to mid-single-digit exposure. |
| Jeffrey Stantial | Stifel | Licensed B2B distributors reselling into unregulated markets | Asked whether B2B resellers selling into unregulated markets sit inside the low to mid-single-digit figure and, if not, how material those relationships are. The answer restated the top-down revenue bridge and added the maximum-12% simulation figure; the reseller channel itself was not sized. |
| Chad Beynon | Macquarie | Prediction-market ramp and commercial model | Asked which constituent — exchange, broker or market maker — matters most for a back-half ramp. Koerl distinguished exchange needs (ultra-low latency data and settlement) from market-maker needs (prediction models on deep data), and described the intended model as a fixed fee plus revenue share with a minimum guarantee, still in negotiation. |
| Shaun Kelley | BofA | Normalized MTS results and what changed in the outlook | Asked management to normalize the outcome-driven MTS shortfall and to lay out the puts and takes since last quarter. Felenstein did not give a normalized figure but did break the outlook change into three parts: a slower U.S. market, more prediction-market contribution, and better IMG cross-sell, with cost savings weighted to the back half. |
| Raymond Bowers | Wells Fargo | Second-quarter guidance and prediction-market cannibalization | Pressed on whether the company would give a Q2 number given how late in the quarter the call fell. Felenstein declined, saying the company does not guide quarterly, and pointed to marketing softness and U.S. weakness as the drivers of the Q1 gap. Koerl said cannibalization of online sports betting is small on client feedback and the TAM effect is larger. |
| Robin Farley | UBS | Prediction-market deal timing versus guidance | Asked whether announcements would be additive to guidance. Felenstein drew a clear line: anything announced in the short term should be assumed already included; anything later is additive. Koerl said discussions are at a mature stage but there is nothing to announce. |
| Robin Farley | UBS | Quantifying the EBITDA shortfall | Asked management to split the gap between sporting outcomes, FX and sports rights ex-IMG. Felenstein pointed to FX as the largest headwind and reiterated that margin still expanded; the sporting-outcome portion was not separately sized. |
| Michael Hickey | Benchmark | ICE sales-floor allegation | Asked Koerl to address the specific claim that sales staff were receptive to prospects from illegal markets. Koerl described it as a sting on a junior salesperson at a trade show, said the recording did not reflect all his statements, and argued a sales conversation is far from a contract given the subsequent KYC, license and sanctions checks. |
| William Lampen | BTIG | Recourse on B2B sublicensing, and customer renewals | Asked whether liability for a negative event sits with the B2B partner rather than Sportradar. Koerl used a Bloomberg analogy, said some B2B partners syndicate content without the company's awareness and are shut down when found, and characterized the bulk of pirated content as live match trackers rather than betting functionality. Felenstein said roughly two-thirds of revenue is fixed fee, about a third of which renews each year, and framed those renewals as back-half upside. |
Theme tracker
Themes are curator-classified across supplied calls.
| Theme | Status | Quarters mentioned | Read-through |
|---|---|---|---|
| IMG ARENA rights integration and revenue synergies | persisted | Q4 2024, Q1 2025, Q2 2025, Q3 2025, Q4 2025, Q1 2026 | Announced in Q4 2024, closed in Q4 2025, and the single most consistent management talking point since. The framing has tightened from strategic rationale to a measurable 25% revenue synergy target, which management said in Q1 2026 it expects to exceed. It is also the reason the 2026 flow-through is lower than 2025's, a point Felenstein made when the Q4 2025 guide landed. |
| Prediction markets | emerged | Q2 2025, Q3 2025, Q4 2025, Q1 2026 | First raised by an analyst in Q2 2025 and management-led from Q3 2025 onward. The tone moved from conditional participation to a named driver inside guidance in three quarters, but through Q1 2026 no agreement had been announced. It is now the most-asked topic on the call and the least evidenced by contracts. |
| Margin expansion from a fixed, long-dated sports rights base | persisted | Q2 2023, Q3 2023, Q4 2023, Q1 2024, Q2 2024, Q3 2024, Q4 2024, Q1 2025, Q2 2025, Q3 2025, Q4 2025, Q1 2026 | Present in every call reviewed, with the same mechanic each time: rights amortized straight-line against a growing revenue base. The 2023-2024 version was a promise of an inflection; from Q4 2024 it became a reported outcome. This is the most durable claim in the file and the one with the clearest track record behind it. |
| Managed Trading Services scale and trading outcomes | persisted | Q2 2023, Q3 2023, Q4 2023, Q1 2024, Q2 2024, Q3 2024, Q4 2024, Q1 2025, Q2 2025, Q3 2025, Q4 2025, Q1 2026 | Turnover growth has been reported every quarter, but outcome sensitivity has surfaced three times in the window: the Q3 2023 revenue cut on favorite-heavy soccer results, a limited impact acknowledged in Q3 2025, and again in Q1 2026 on player-friendly February soccer. Management's answer each time is diversity of sports and normalization over time; the pattern is worth noting for a line described as low-volatility. |
| iGaming as an adjacent market | persisted | Q4 2024, Q1 2025, Q2 2025, Q3 2025, Q4 2025, Q1 2026 | Framed as a Brazil test market for five consecutive calls, always with the same 360-degree acquisition-to-retention logic. In Q1 2026 the framing changed: a dedicated brand, Playradar, live across Latin America with a stated European, U.S. and Canadian rollout for the year, built organically with existing resources. |
| Buyback scale and the valuation-gap argument | persisted | Q4 2023, Q1 2024, Q2 2024, Q3 2024, Q4 2024, Q1 2025, Q2 2025, Q3 2025, Q4 2025, Q1 2026 | The authorization has escalated steadily — $200 million in Q4 2023, raised to EUR 300 million in Q3 2025, to $1 billion in Q4 2025, with a $250 million enhanced open market program and a stated personal purchase by the CEO in Q1 2026. Capital-allocation language has moved from investment-first to Felenstein saying there is currently no better use of capital than investing in Sportradar shares. |
| Gray-market exposure and data distribution controls | emerged | Q3 2025, Q1 2026 | First put to management as an aside in Q3 2025, when Koerl described a four-level compliance process. By Q1 2026 it dominated the call, came with a filed 6-K, a quantified revenue bridge and a direct rebuttal of the reports. A short history, but it now sits alongside guidance as the main thing analysts want resolved. |
| U.S. in-play conversion as the quantified growth lever | dropped | Q3 2023, Q4 2023, Q1 2024, Q2 2024, Q3 2024, Q1 2025, Q2 2025, Q3 2025 | For eight calls management put a number on it — roughly 35% of U.S. handle moving toward the 70% to 80% international rate, worth a stated amount of EBITDA per point converted. Neither the Q4 2025 nor the Q1 2026 call returned to it, and no analyst asked. Prediction markets appear to have taken its place as the U.S. growth story. |
| Taiwan Lottery and the managed platform business | dropped | Q3 2023, Q4 2023, Q2 2024, Q3 2024, Q4 2024 | A named growth proof-point through 2023 and then purely a lapping comparison through 2024, after which it disappears from both remarks and questions. Read as a one-off installation rather than a repeatable platform channel, which is roughly how management came to describe it. |
Guidance ledger
Quotes, calls, and speakers are source-verified; outcomes are curator-classified.
| Verbatim guidance | Call | Speaker | Curator outcome | Outcome note |
|---|---|---|---|---|
| “As such, we still anticipate constant currency revenue growth of 23% to 25%, which at current FX rates is expected to be between $1.56 billion and $1.58 billion reported.” | Sportradar Group AG, Q1 2026 Earnings Call, Apr 28, 2026 · 2026-04-28T12:00:00 | Craig Felenstein | pending | Reaffirmed at the same range set on the Q4 2025 call. Q1 reported growth was 11%, with management attributing the gap to FX, marketing timing and slower U.S. growth and pointing to Q2 and Q3 as the strongest growth quarters. |
| “We expect to drive significant operating leverage on this revenue growth with adjusted EBITDA growth of 34% to 37% on a constant currency basis, which at current FX rates is expected to be $390 million to $400 million reported with approximately 200 to 225 basis points of margin expansion in 2026.” | Sportradar Group AG, Q1 2026 Earnings Call, Apr 28, 2026 · 2026-04-28T12:00:00 | Craig Felenstein | pending | Unchanged from the Q4 2025 guide. Q1 delivered slight margin expansion, with the cost-out program weighted to the back half. |
| “restructuring charges of between $13 million and $18 million during the remainder of the year” | Sportradar Group AG, Q1 2026 Earnings Call, Apr 28, 2026 · 2026-04-28T12:00:00 | Craig Felenstein | pending | First restructuring charge quantified since the 2023 workforce reduction. Management said some of the resulting savings are already factored into back-half margin guidance. |
| “we anticipate revenue of EUR 1.56 billion to EUR 1.58 billion” | Sportradar Group AG, Q4 2025 Earnings Call, Mar 03, 2026 · 2026-03-03T13:30:00 | Craig Felenstein | pending | The first formal 2026 revenue guide; reaffirmed unchanged on the Q1 2026 call. |
| “we will continue to focus on converting more of every dollar to cash flow and anticipate growing our free cash flow conversion rate above the 56% we delivered in 2025” | Sportradar Group AG, Q4 2025 Earnings Call, Mar 03, 2026 · 2026-03-03T13:30:00 | Craig Felenstein | pending | Q1 2026 conversion was 67% versus 54% a year earlier, and management repeated the above-56% expectation for the full year. |
| “current expectations for the consolidated company is an additional 250 basis points of margin expansion in 2026” | Sportradar Group AG, Q3 2025 Earnings Call, Nov 05, 2025 · 2025-11-05T13:30:00 | Craig Felenstein | pending | The formal guide issued one quarter later was 200 to 225 basis points, below this initial indication. Felenstein attributed the lower flow-through mainly to consolidating IMG revenue at close to base-business margins and to one-off Q4 2025 savings. |
| “We now anticipate revenues of at least EUR 1.290 billion, representing year-over-year growth of at least 17% and adjusted EBITDA of at least EUR 290 million, representing growth of at least 30% versus 2024.” | Sportradar Group AG, Q3 2025 Earnings Call, Nov 05, 2025 · 2025-11-05T13:30:00 | Craig Felenstein | kept | The Q4 2025 call reported full-year revenue of EUR 1.3 billion, up 17%, and record adjusted EBITDA of EUR 297 million, up 33%. |
| “We currently anticipate 2026 revenue growth, including IMG, to accelerate to 23% to 25% range on a constant currency basis.” | Sportradar Group AG, Q3 2025 Earnings Call, Nov 05, 2025 · 2025-11-05T13:30:00 | Craig Felenstein | pending | Carried forward unchanged into the formal Q4 2025 guide and reaffirmed again in Q1 2026. |
| “We now anticipate revenues of at least EUR 1.278 billion, representing year-over-year growth of at least 16%. And we now anticipate adjusted EBITDA of at least EUR 284 million, representing growth of at least 28% versus 2024.” | Sportradar Group AG, Q2 2025 Earnings Call, Aug 05, 2025 · 2025-08-05T12:30:00 | Craig Felenstein | kept | Raised again in Q3 2025 and exceeded on the full year, with reported revenue of EUR 1.3 billion and adjusted EBITDA of EUR 297 million. |
| “For the full year, 2025, we anticipate total company revenue of at least EUR 1.273 billion, representing year-over-year growth of at least 15%” | Sportradar Group AG, Q4 2024 Earnings Call, Mar 19, 2025 · 2025-03-19T12:30:00 | Craig Felenstein | kept | The opening 2025 guide, excluding IMG. It was held in Q1 2025 despite FX, raised in Q2 and again in Q3, and finished at EUR 1.3 billion. |
| “As a reminder, during our Investor Day, we laid out 3-year targets, including 15% revenue CAGR through 2027, which when combined with our stable cost base, will drive margins to 27% by 2027 and over 30% longer term.” | Sportradar Group AG, Q1 2025 Earnings Call, May 12, 2025 · 2025-05-12T12:30:00 | Craig Felenstein | pending | Management said on the Q4 2025 call that 2025 ran ahead of year-one expectations against these targets. Two years remain in the window and IMG has since been added to the base. |
| “We now anticipate revenues of at least EUR 1.09 billion, an increase of EUR 20 million versus our prior guidance and up 24% versus 2023. And we now anticipate adjusted EBITDA of at least EUR 216 million, up EUR 12 million versus our prior guidance and growth of at least 29% versus 2023.” | Sportradar Group AG, Q3 2024 Earnings Call, Nov 07, 2024 · 2024-11-07T13:00:00 | Craig Felenstein | kept | The Q4 2024 call reported full-year revenue of EUR 1.1 billion, up 26%, and adjusted EBITDA of EUR 222 million, up 33%. |
| “We now anticipate revenues of at least EUR 1.07 billion and adjusted EBITDA of at least EUR 204 million or growth of at least 22% versus 2023 on both the top and bottom line.” | Sportradar Group AG, Q2 2024 Earnings Call, Aug 13, 2024 · 2024-08-13T12:30:00 | Craig Felenstein | kept | Raised again in Q3 2024 and beaten on the full year on both lines. |
Q&A pressure map
Question counts and firms are curator tallies; analyst coverage shown above.
| Topic | Questions | Firms | Pressure / response |
|---|---|---|---|
| Short-seller allegations, gray-market exposure and data piracy (Q1 2026) | 6 | Craig-Hallum, Truist, Stifel, Benchmark, Wells Fargo, BTIG | The single heaviest line of questioning on the latest call, covering revenue exposure to unregulated markets, regulator and league reaction, the ICE sales-floor recording, the claim that profits come from lower-tier leagues, and where liability sits when a B2B partner sublicenses content. Management answered each directly and quantified exposure, but one question went unanswered on its own terms: Stifel asked specifically whether licensed B2B resellers distributing into unregulated markets are inside the low to mid-single-digit figure and how material those relationships are, and the reply re-ran the same top-down revenue bridge without sizing the reseller channel. |
| Prediction markets (Q1 2026) | 6 | Macquarie, Truist, Stifel, Wells Fargo, UBS, JPMorgan | Asked from six angles — ramp timing, which constituent matters most, state-level legal limits, marketing and user-acquisition traction, cannibalization of online sports betting, and where the revenue lands at maturity. The answers were consistent and consistently pre-contractual: leagues have granted clearance, product is ready, the model is a fixed fee plus revenue share with a minimum guarantee, and announcements are expected soon. Felenstein's clarification that near-term announcements are already inside guidance is the most useful modelling detail given. |
| Guidance credibility after a soft Q1 (Q1 2026) | 5 | Craig-Hallum, BofA, UBS, JPMorgan | Analysts came at the same question repeatedly: what supports an unchanged full-year guide, can the MTS outcome effect be normalized, how much of the EBITDA gap is FX versus sport results, and how the FX headwind phases through the year. Management gave the FX cadence and the three-part bridge on what changed since the last guide, but declined both to quantify the sporting-outcome impact and to give any second-quarter figure. |
| IMG synergy phasing and durability (Q4 2025) | 5 | Craig-Hallum, UBS, BTIG, Stifel, Needham | On the prior call the pressure sat almost entirely on IMG: whether the outperformance was IMG or the core business, how fast the content ramps across the wider client base, where in the product mix the 25% synergy shows up, the phasing of revenue versus cost synergies through 2026, and whether revenue upside is already fully baked. Felenstein was clear that revenue synergies are not fully baked while cost synergies are easier to identify, and that 2027 depends on which IMG content the company chooses to keep. |
Language shifts
Only language evidence verified against the referenced component is shown.
| Observation | Verbatim evidence | Call ID | Component |
|---|---|---|---|
| Prepared remarks acquired a defensive register that has no precedent in the prior eleven calls. The CEO opened by naming and rejecting the reports before turning to results. | “Before we get into the results, I want to address directly the recent self-interested reports published by known short sellers with the intent of driving down our company's stock price.” | 1995730448 | 2 |
| The guidance verb changed. The three prior calls used variants of raising the outlook; this one reaffirms it and pairs the reaffirmation with an acknowledgement of headwinds. | “We are reaffirming our full year 2026 outlook. While there have been some short-term headwinds, there are also a variety of opportunities for the remainder of the year that we expect to capitalize on such as further IMG synergies, the prediction market ecosystem and global customer renewals.” | 1995730448 | 3 |
| U.S. market language turned explicitly negative for the first time in the window. Prior calls described U.S. growth as rapid or strong; here it is a downgrade relative to the guide set eight weeks earlier. | “First and foremost, the U.S. market growth is definitely slower than it was when we were speaking after our fourth quarter results.” | 1995730448 | 29 |
| Cost language moved from managing headcount growth to initiating cuts. The prior four calls framed efficiency as using existing people better; this one names a program with a quantified charge. | “At the same time, we have recently initiated steps to further streamline our business and drive additional cost efficiencies.” | 1995730448 | 3 |
| Prediction-market framing shifted from conditional to assertive in two quarters. In Q3 2025 participation was contingent on how the market developed. | “Should the market continue to develop in the way that aligns with those standards, we see the potential for prediction markets to complement our existing business and create incremental opportunity for Sportradar.” | 1966803230 | 2 |
| By Q1 2026 the same topic is stated as leadership, and the sentence introducing it also concedes the U.S. slowdown — the two are now presented together. | “we see prediction markets as a significant opportunity where Sportradar is uniquely positioned to lead given our premium content, global scale and unmatched product portfolio” | 1995730448 | 2 |
| A new qualifier attached to Managed Trading Services, a line management has otherwise described as insulated from single-event outcomes by its diversity. | “While turnover was strong, our revenues in the quarter were impacted by player-friendly outcomes.” | 1995730448 | 2 |
The call history supports the operating case and complicates the timing case. Nine of the last ten quantified guides were met or beaten, and the margin mechanic management has described since 2023 — long-dated rights amortized straight-line against a growing base — has delivered. What is new in Q1 2026 is that the growth story rests on two things the transcripts do not yet evidence: prediction-market revenue that is inside the guide but not under contract, and IMG synergies now running ahead of a target that was itself only set one quarter earlier. Against that, the reliably quantified U.S. in-play conversion lever has gone unmentioned for two calls.