Sportradar Group AG's management explains the business in its own materials. The slides below do the most of that work, pulled from the documents preserved in Sources. Each source link opens the complete presentation at that slide in a new tab.
Management's fullest account of the business: what it sells, to whom, how the pricing works, and the 2027 targets it set for itself. · Open the full document →
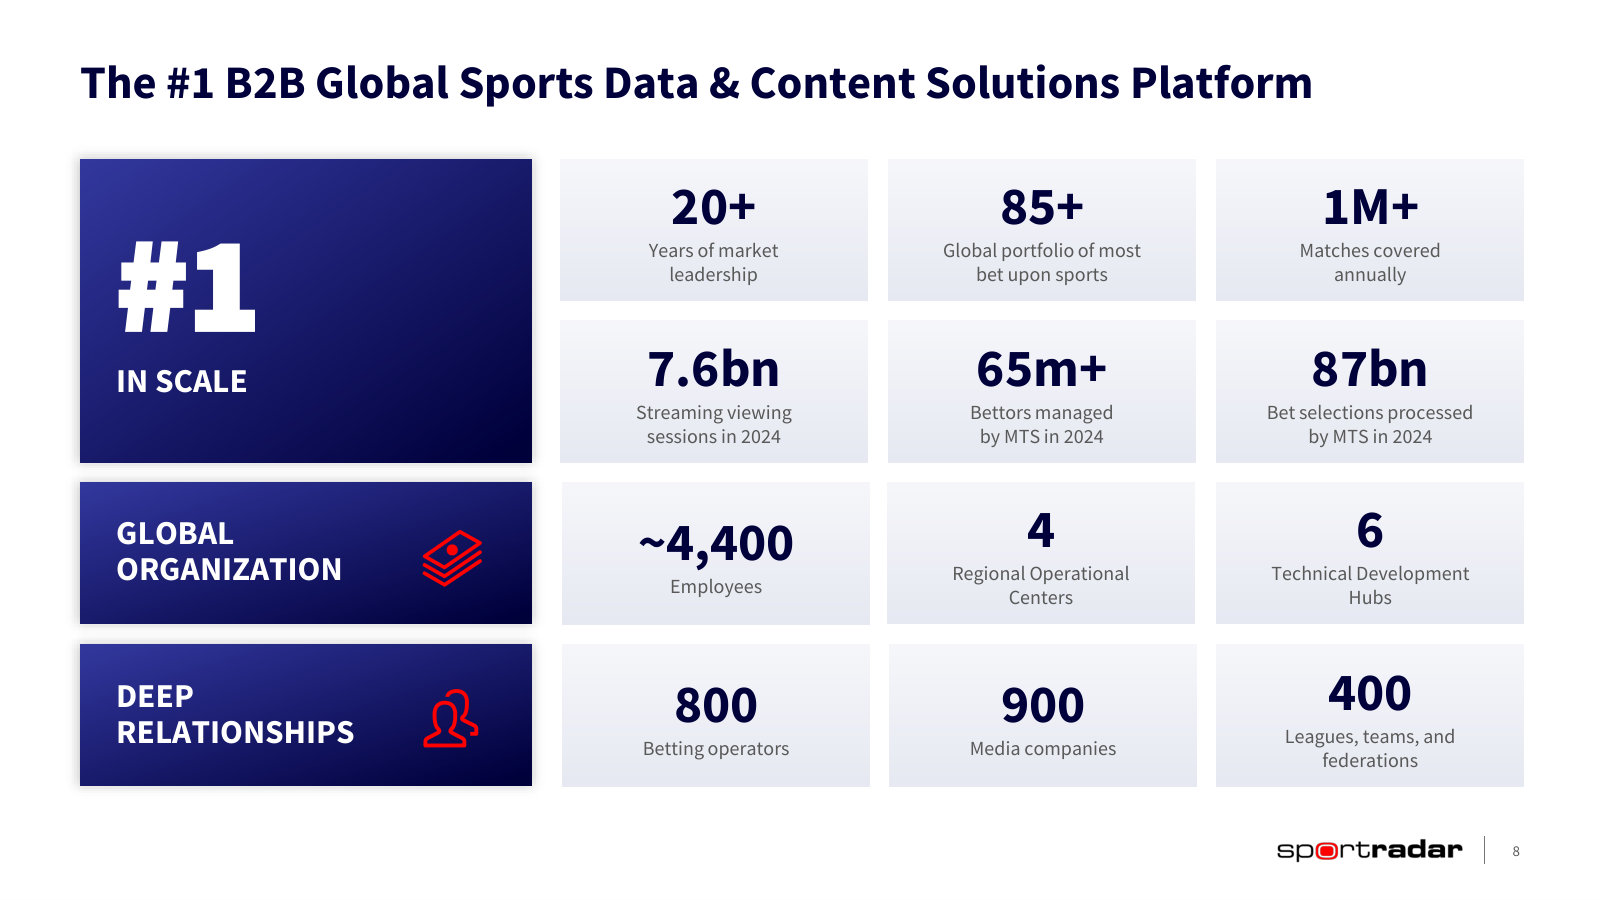
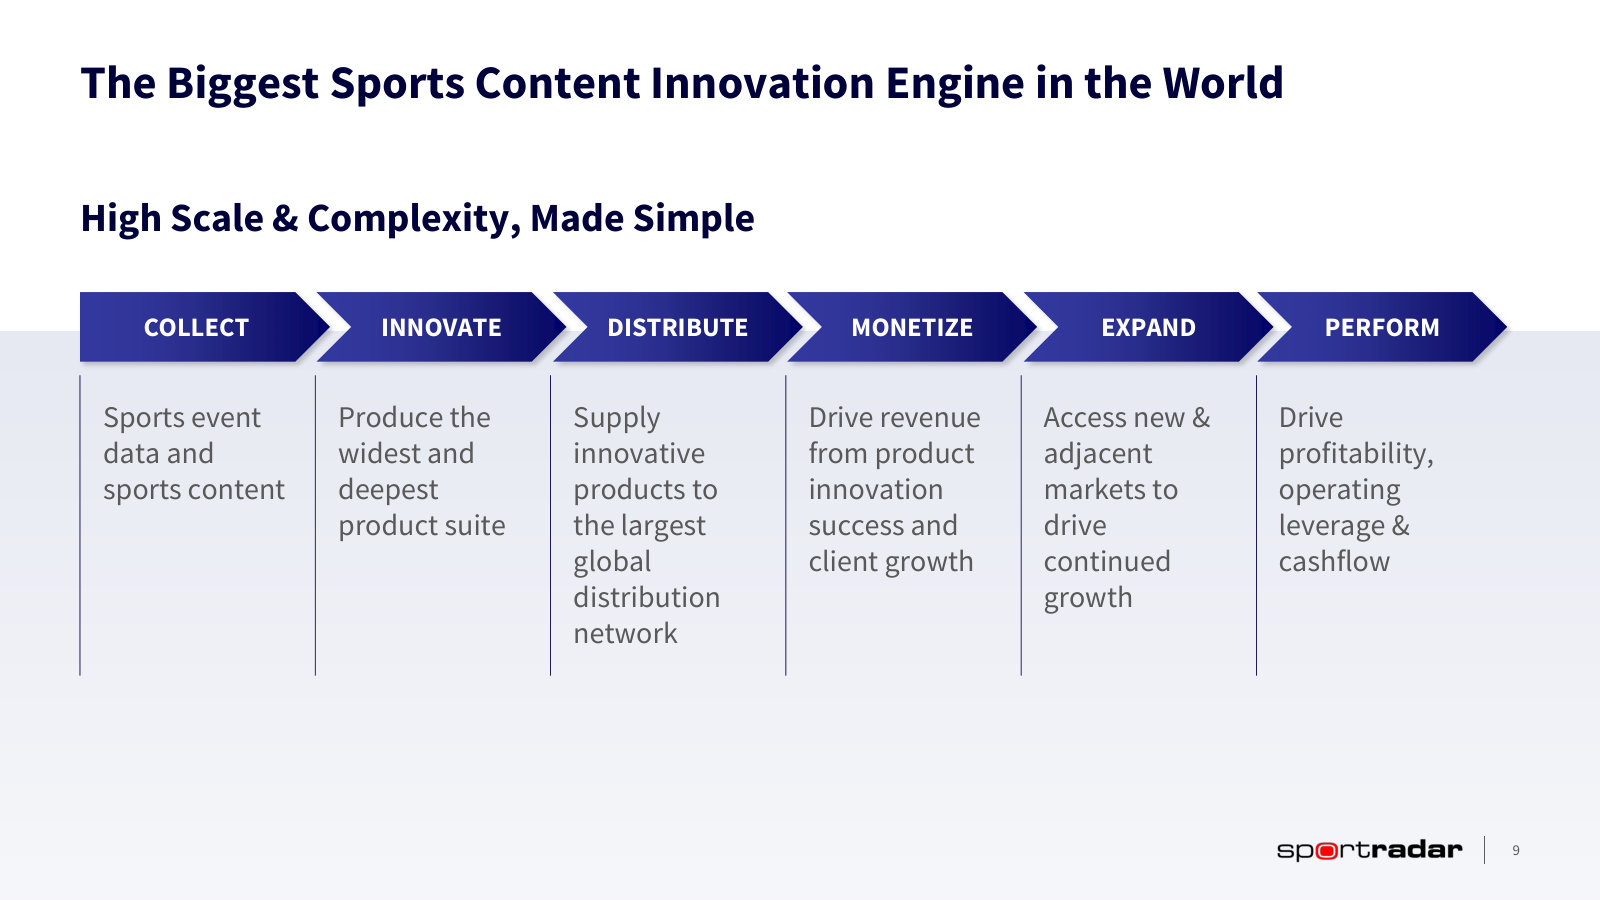
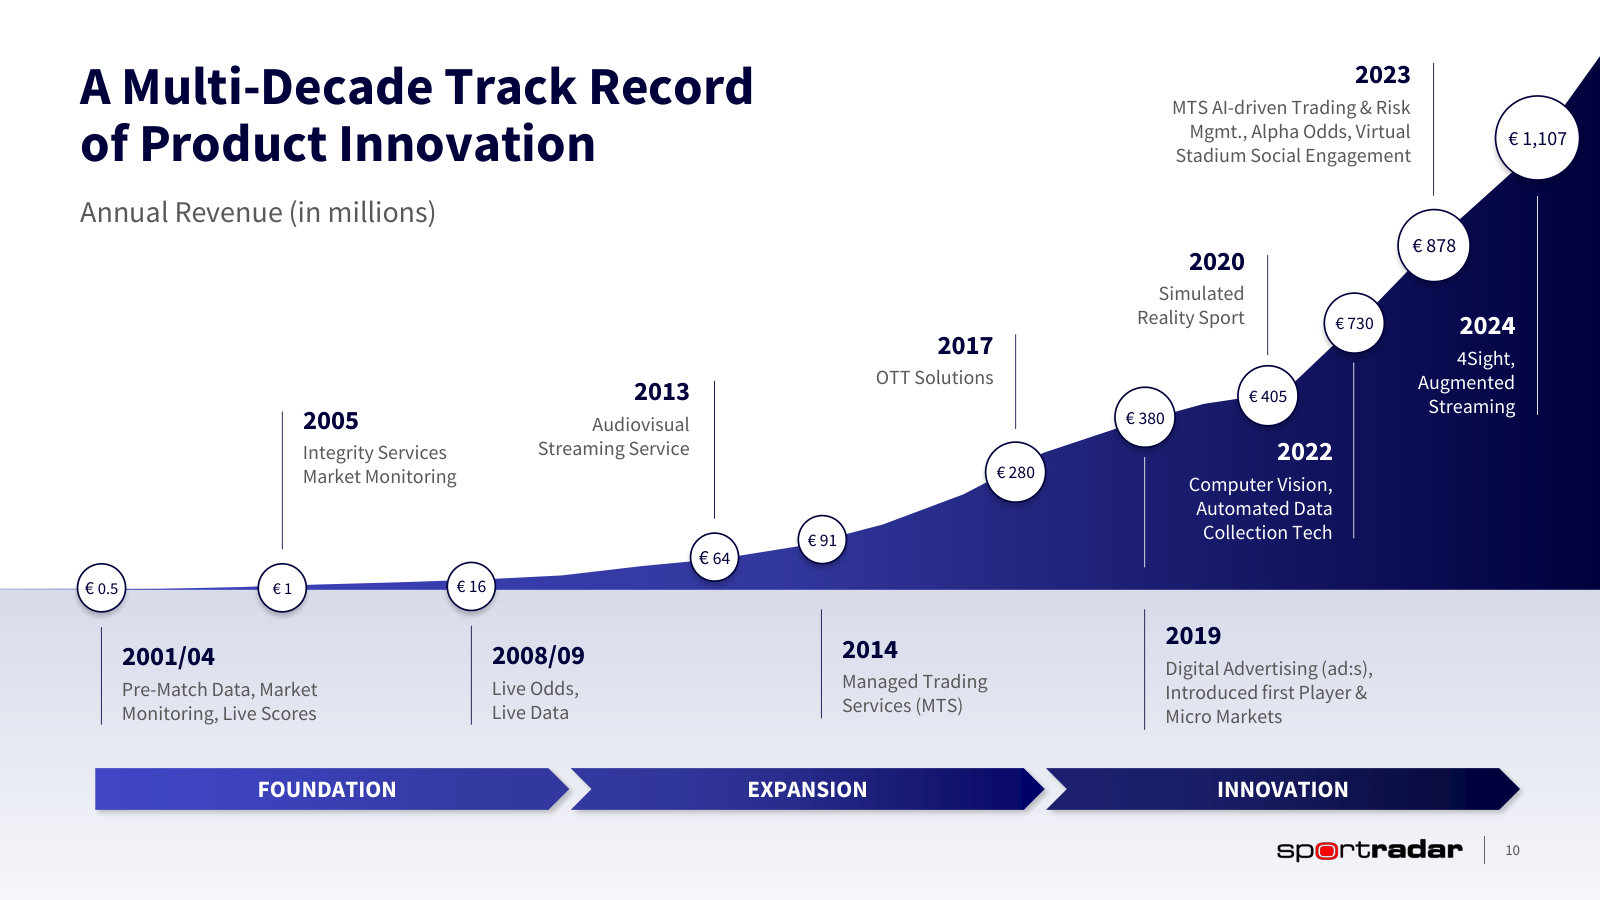
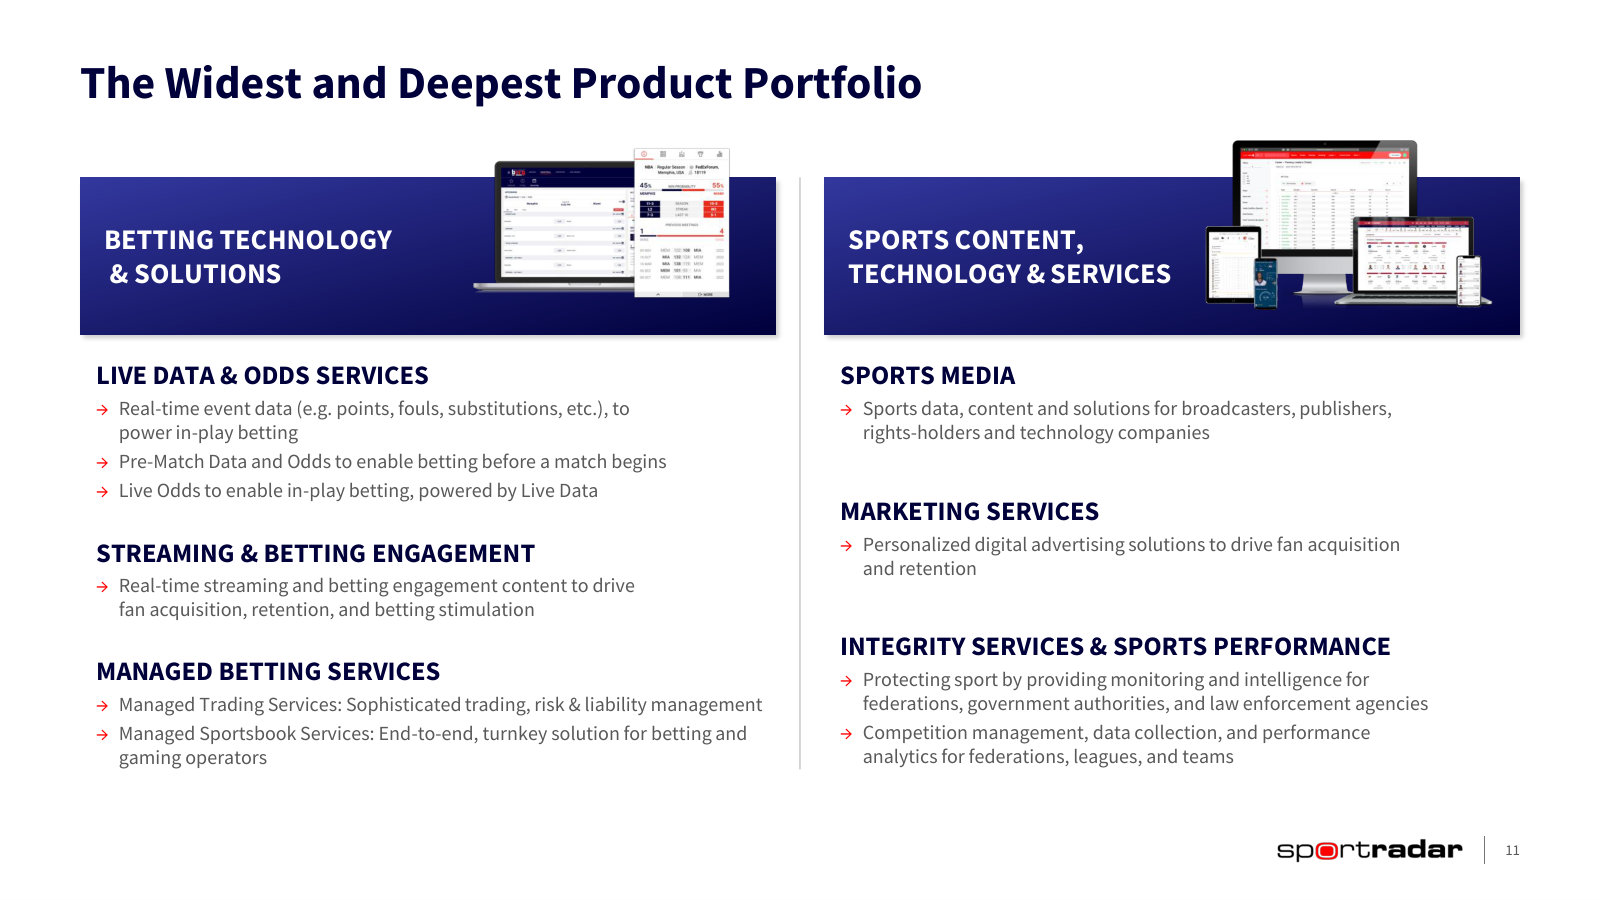
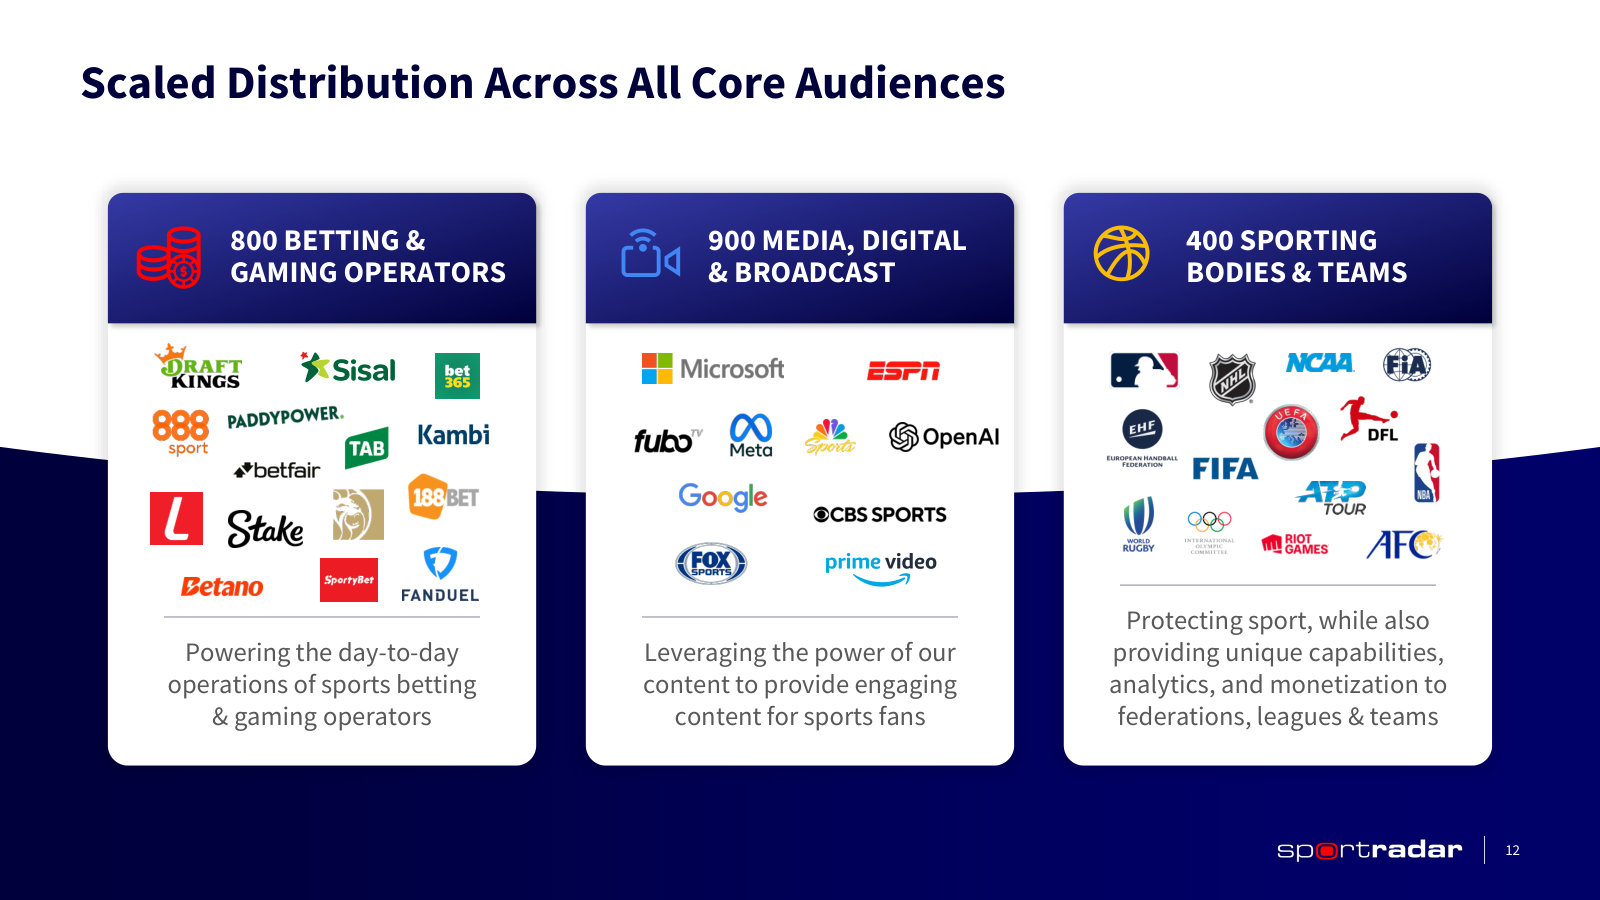
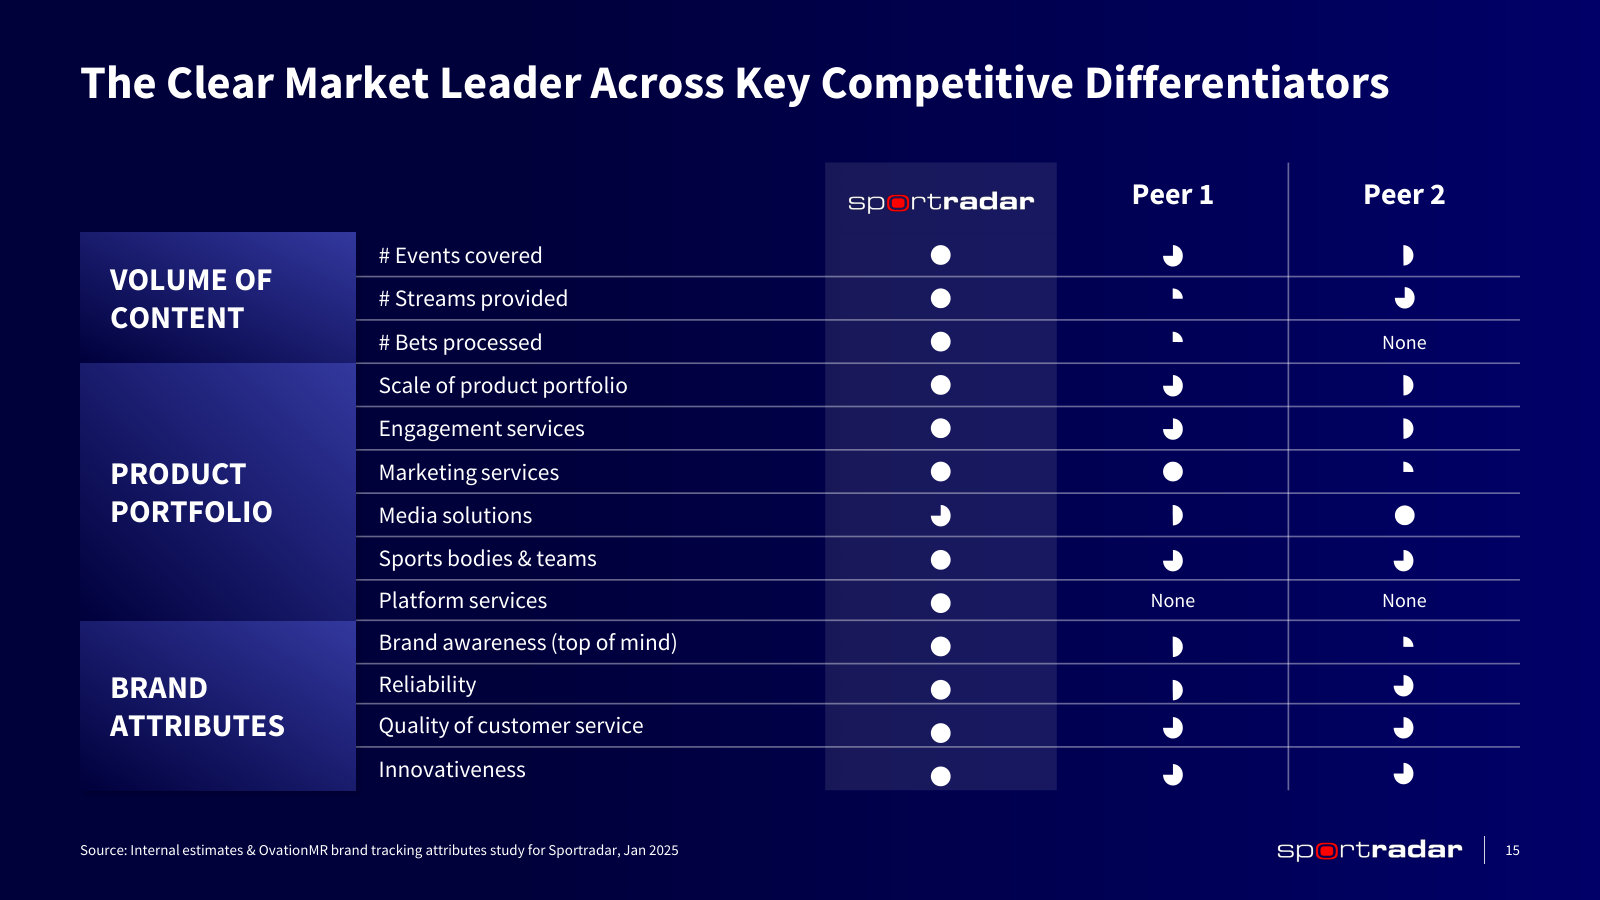
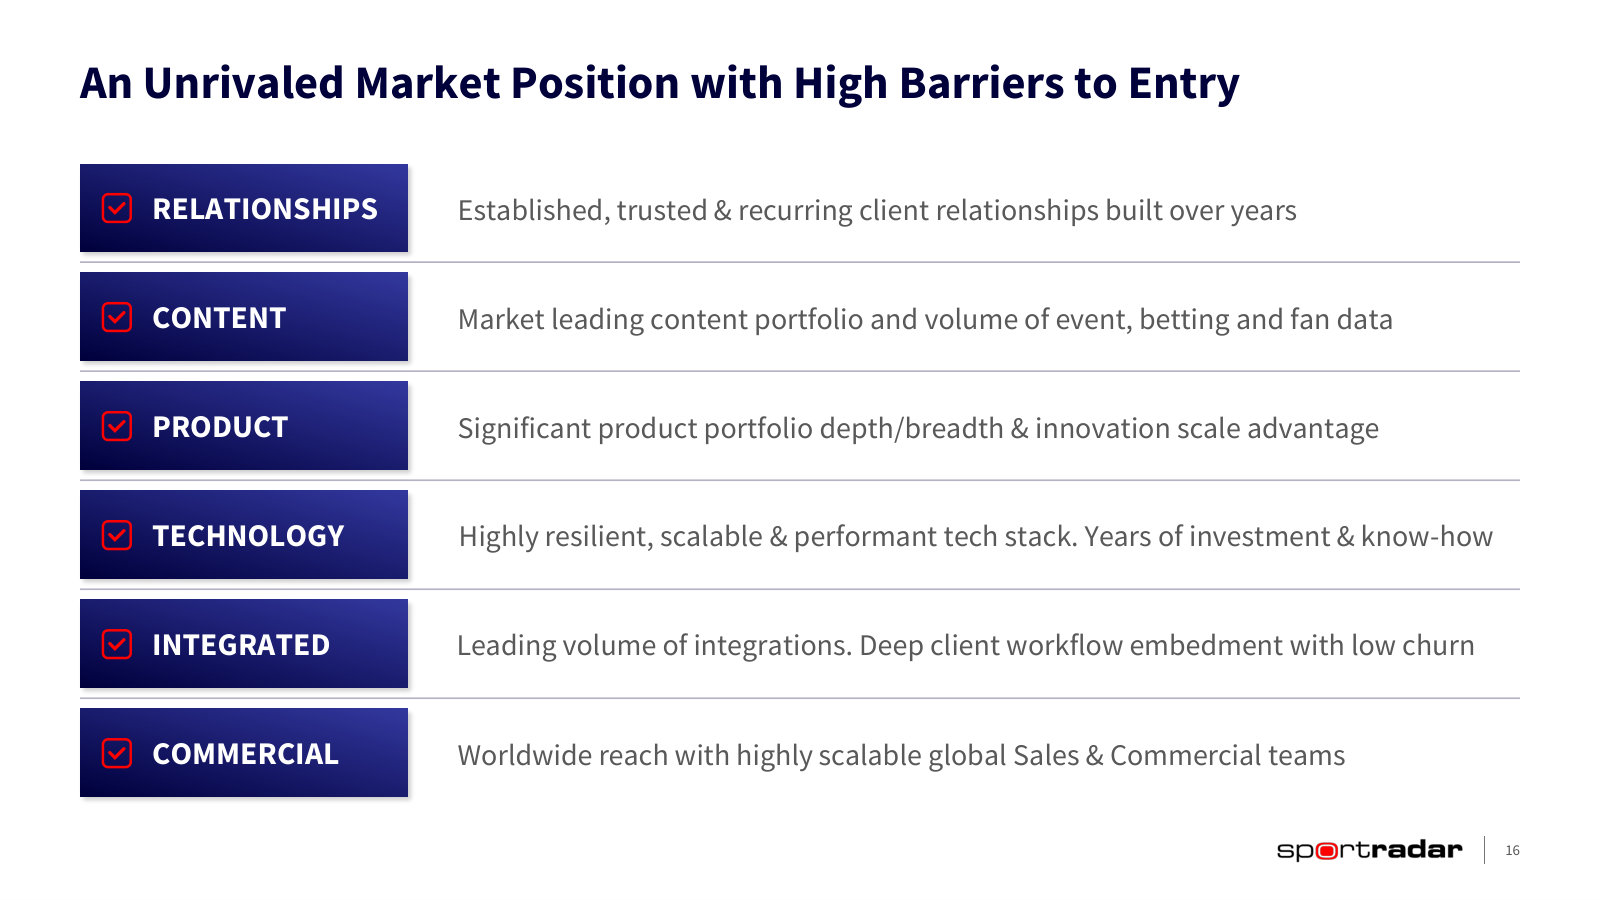
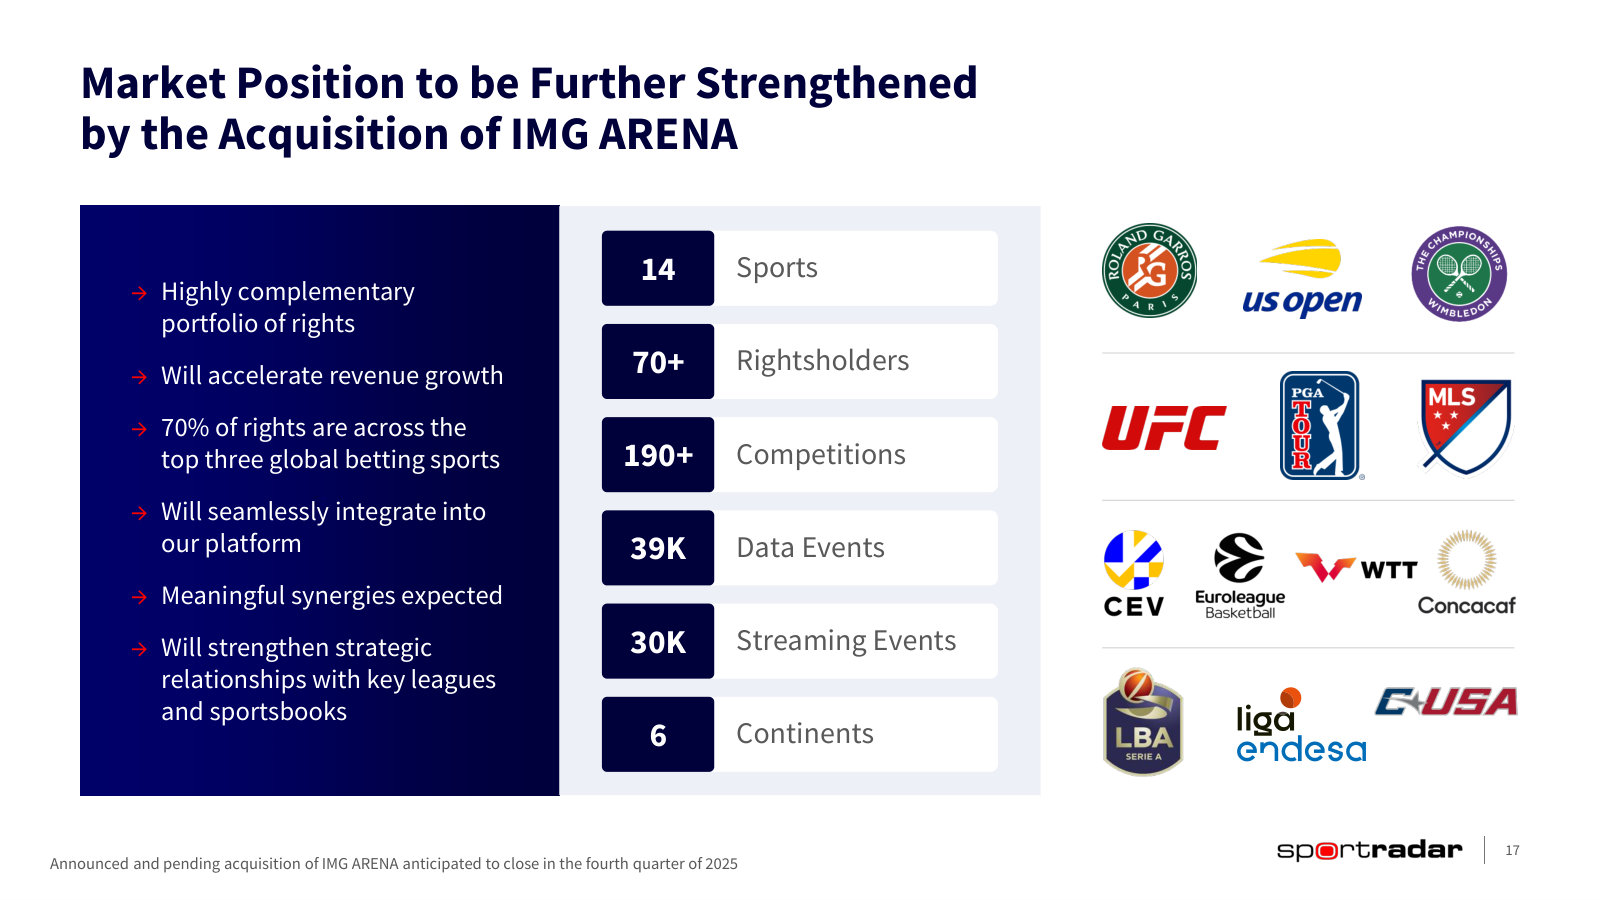
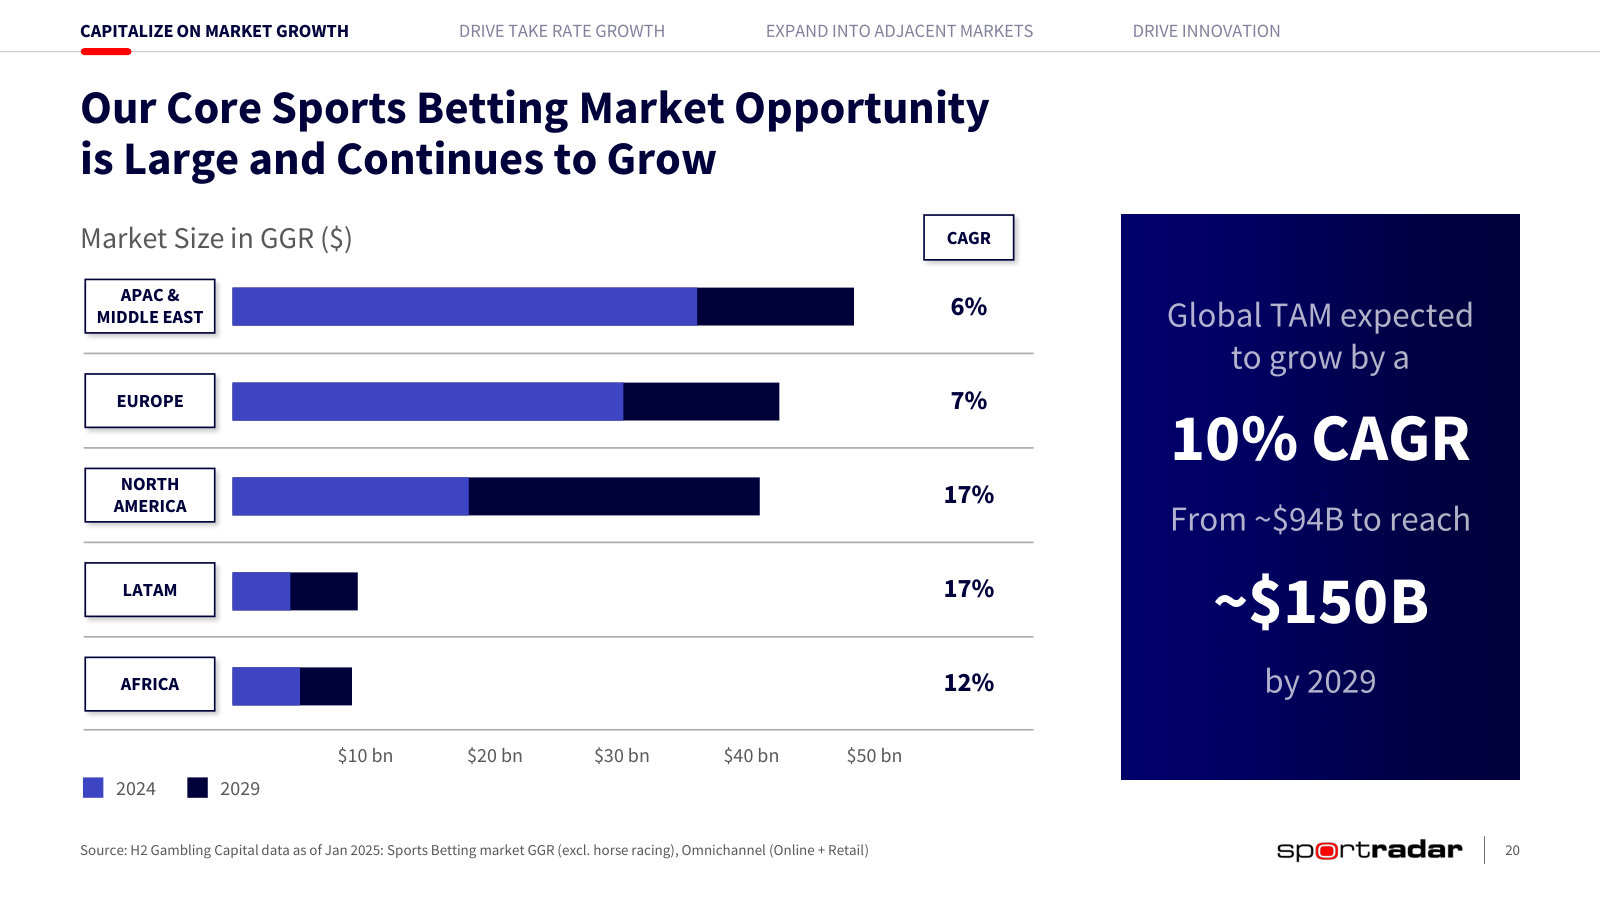
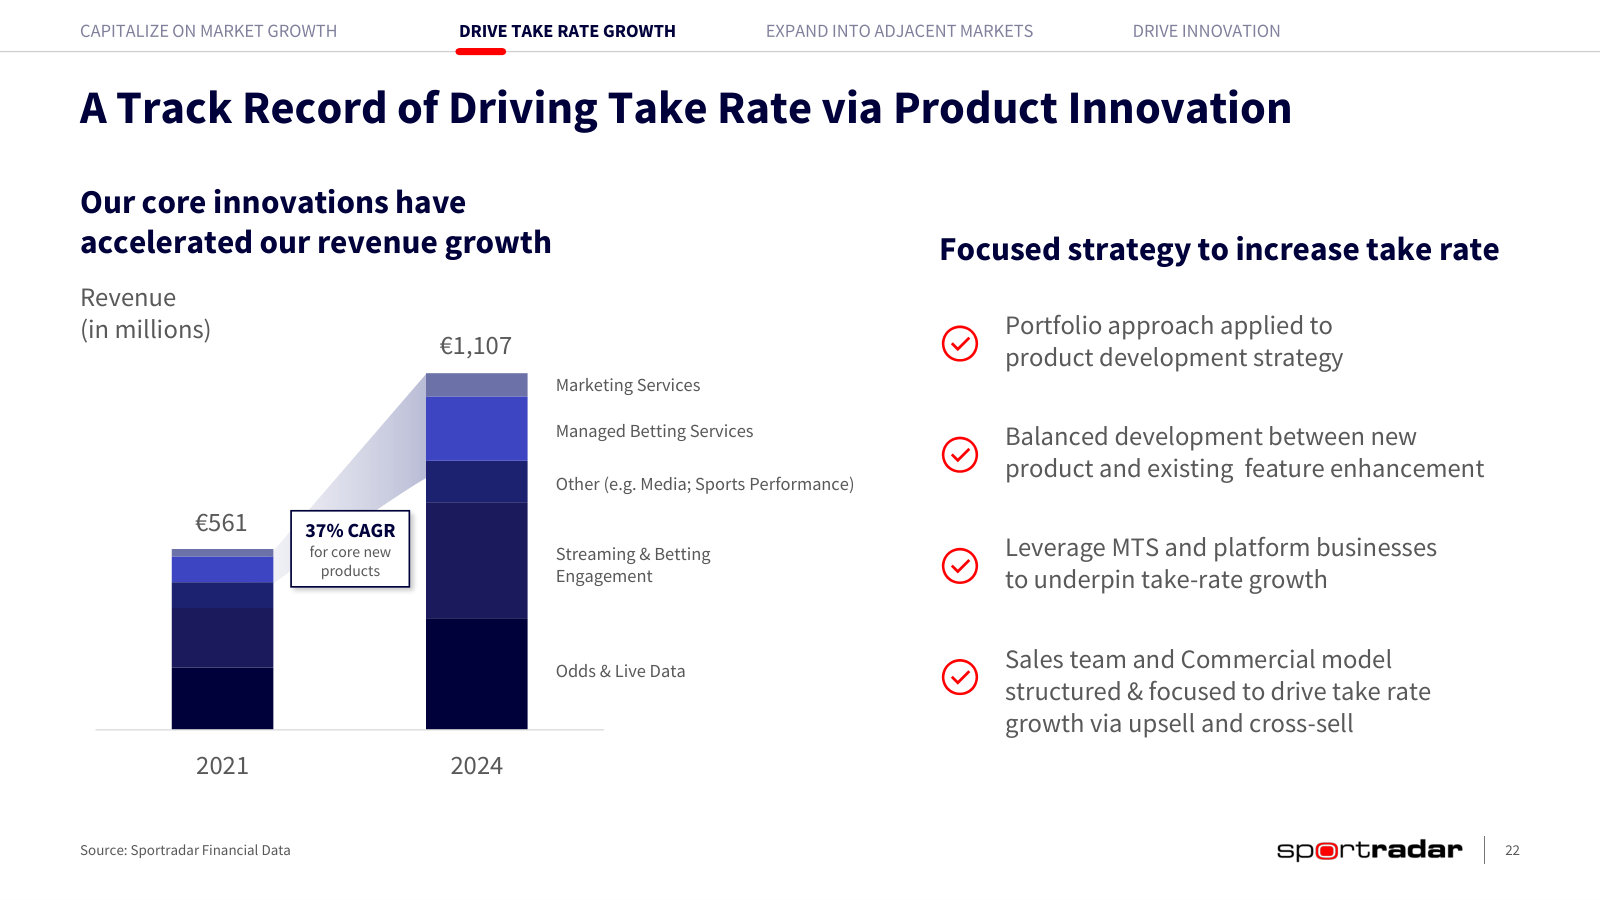
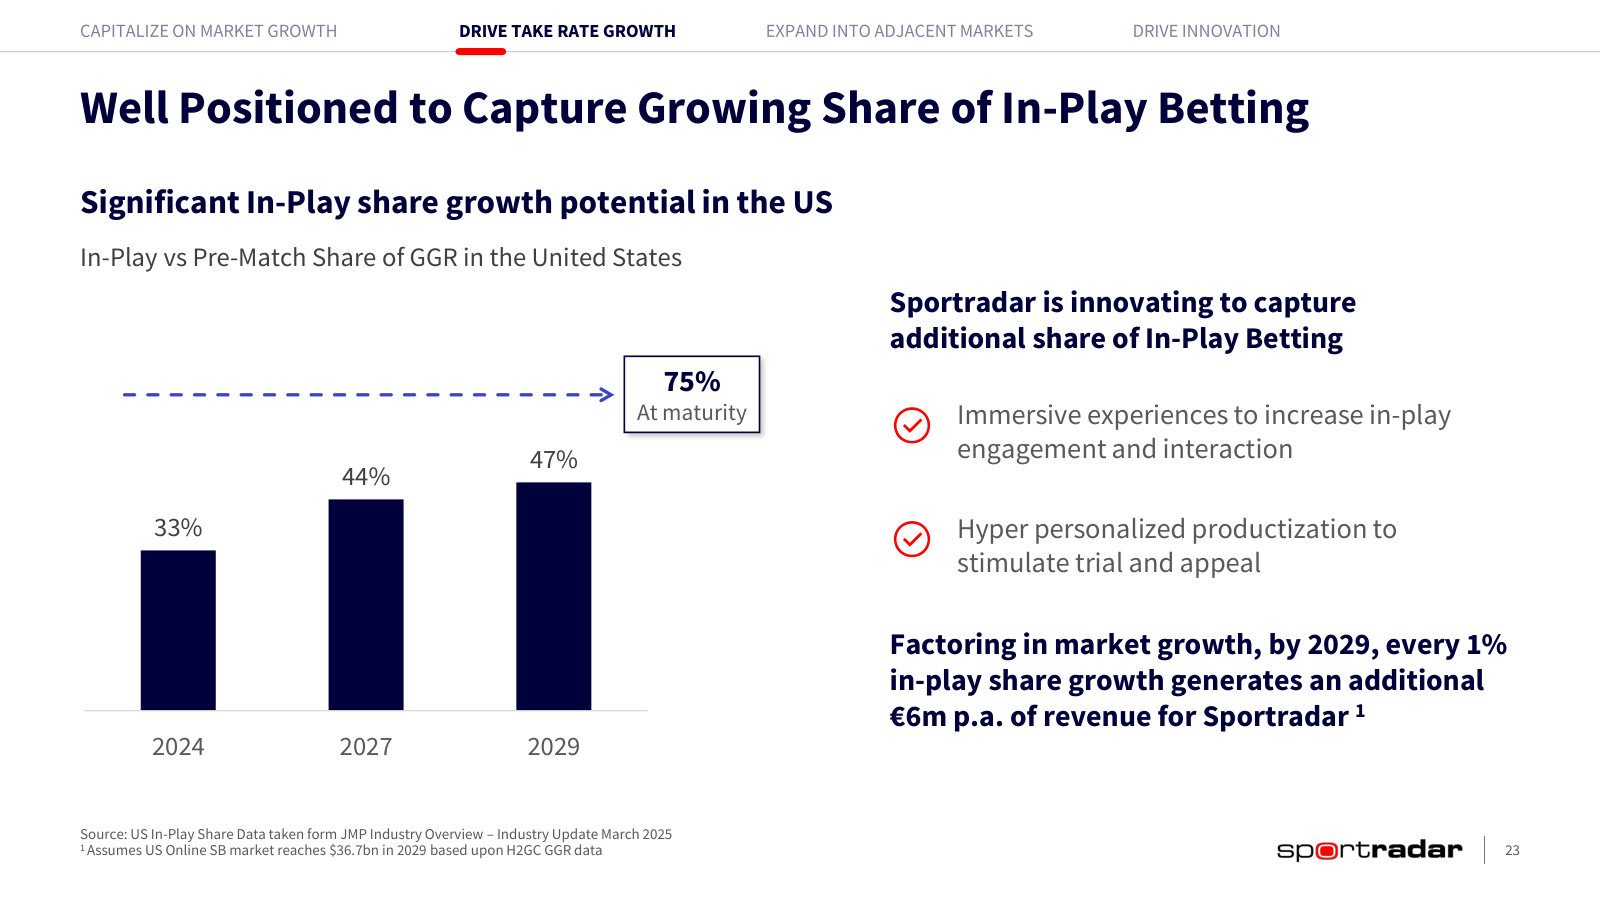
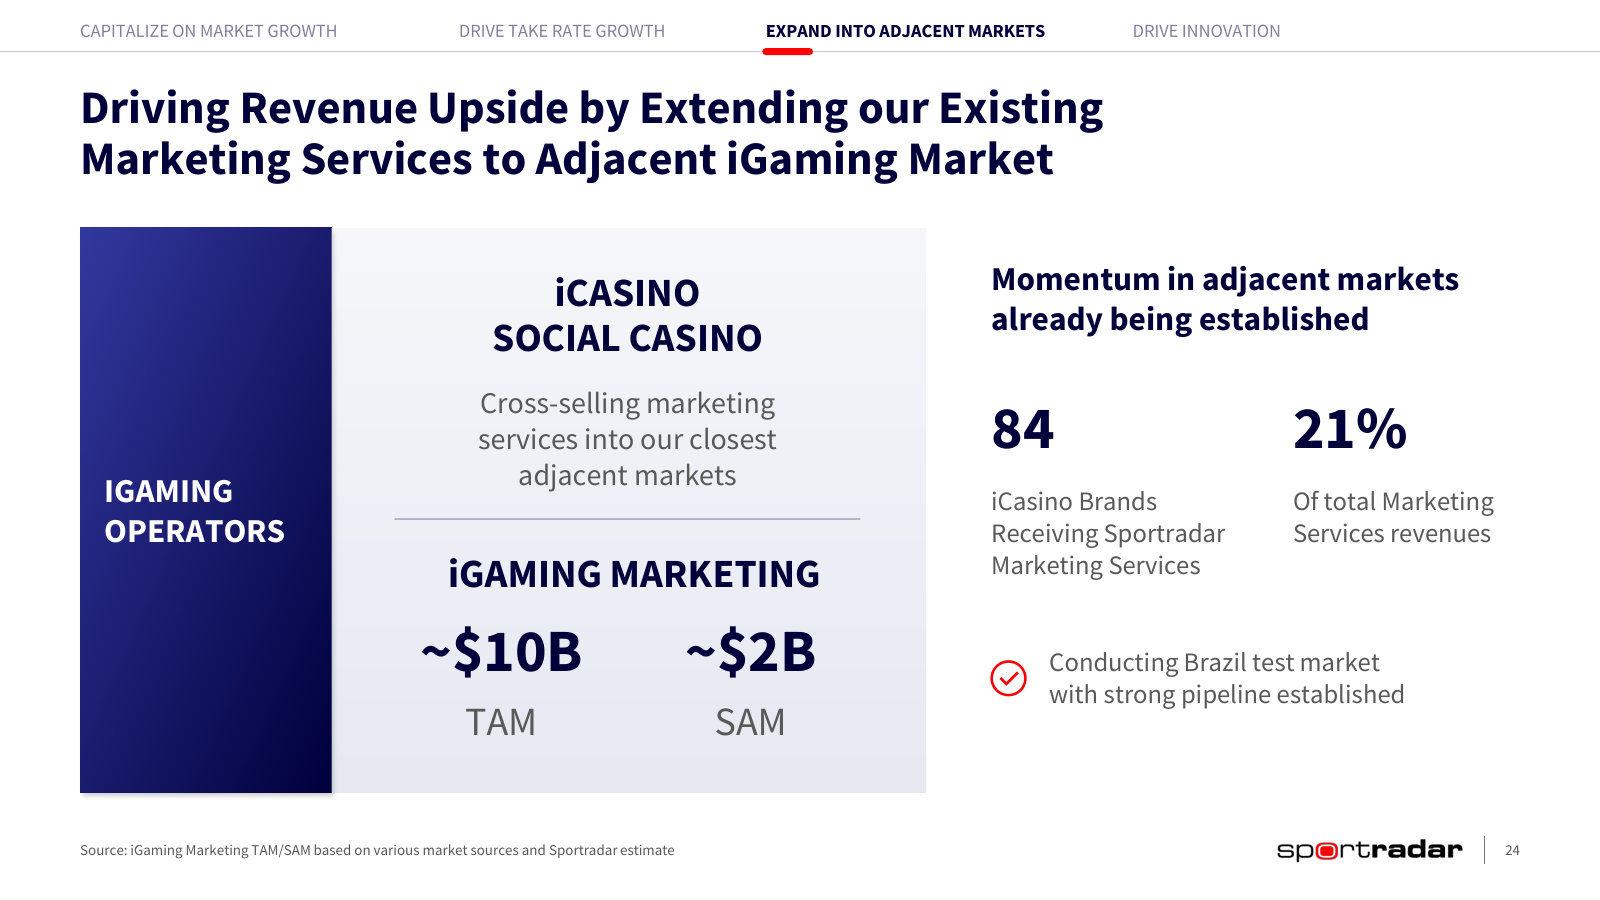
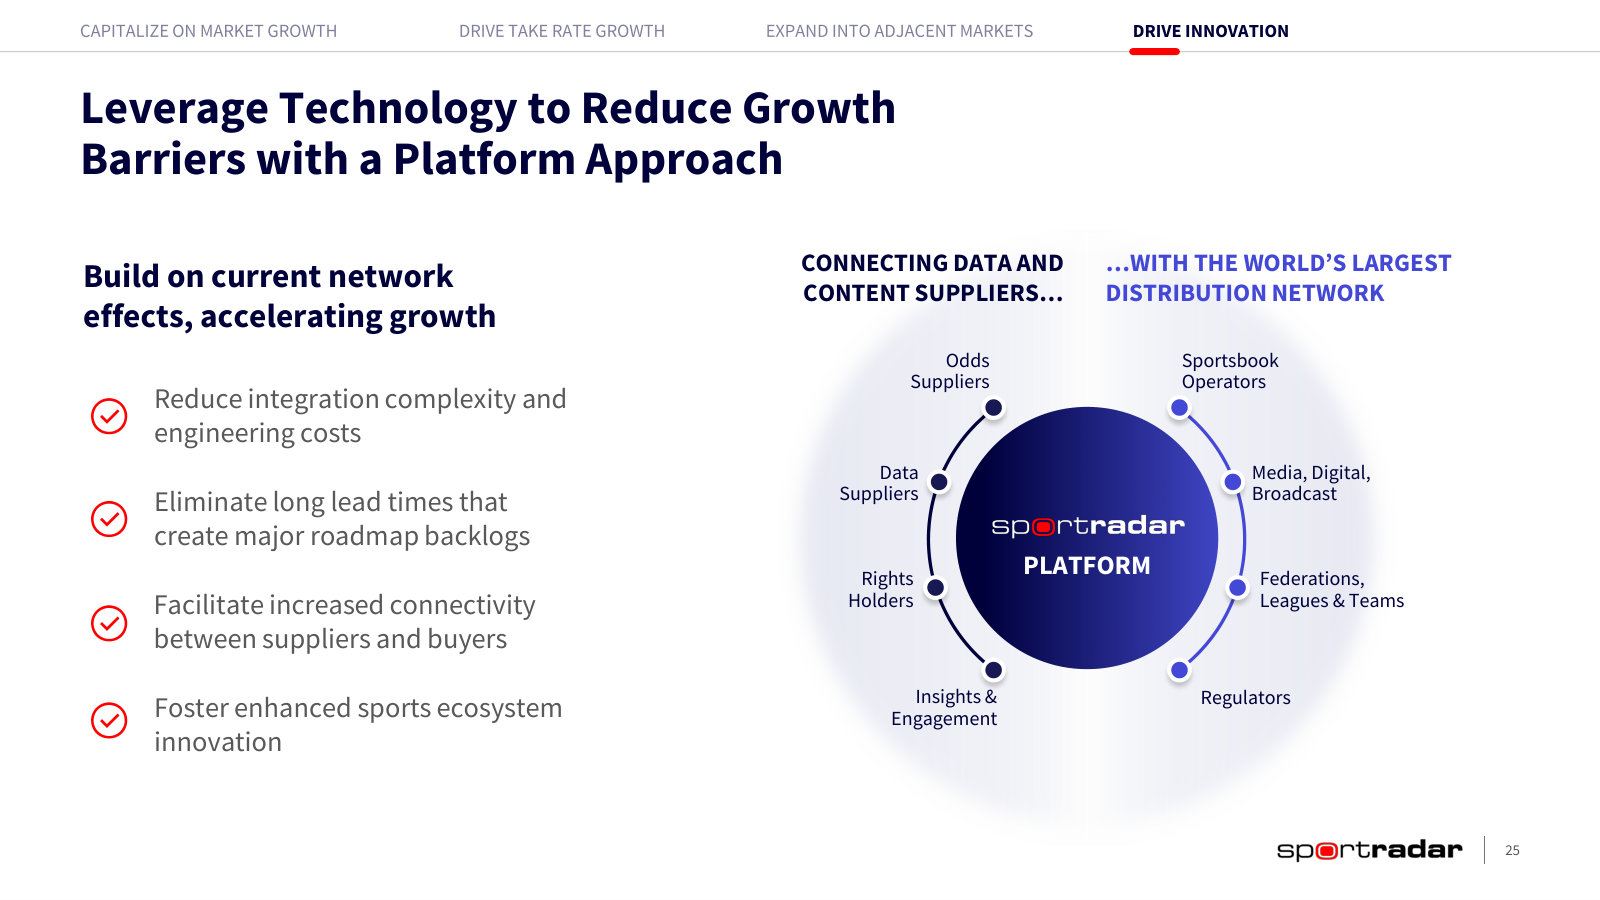
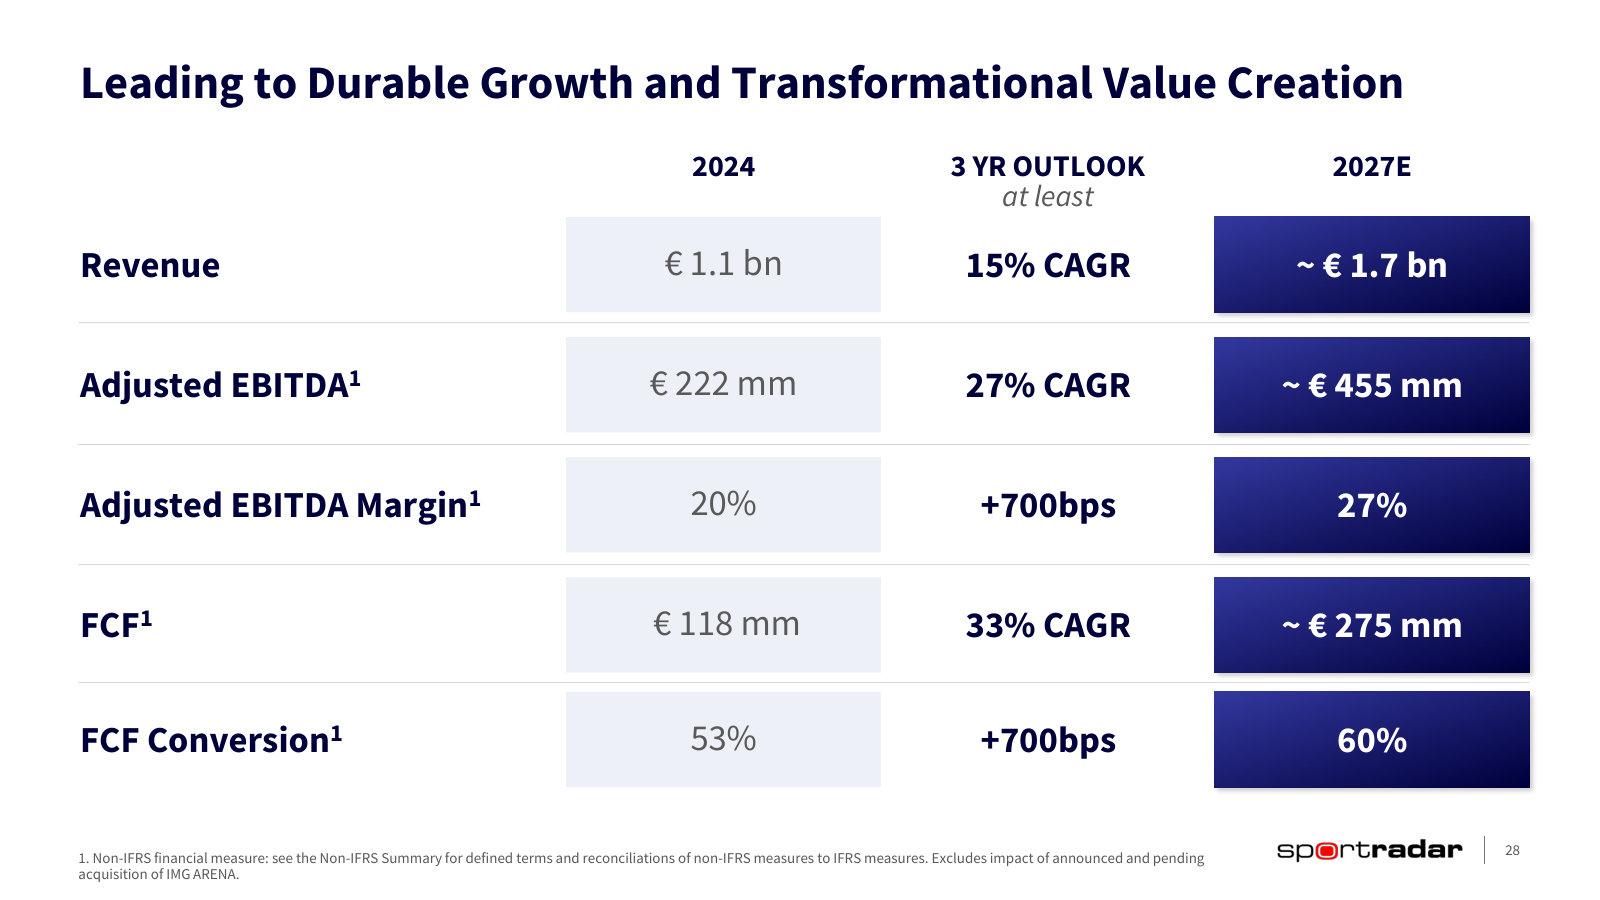
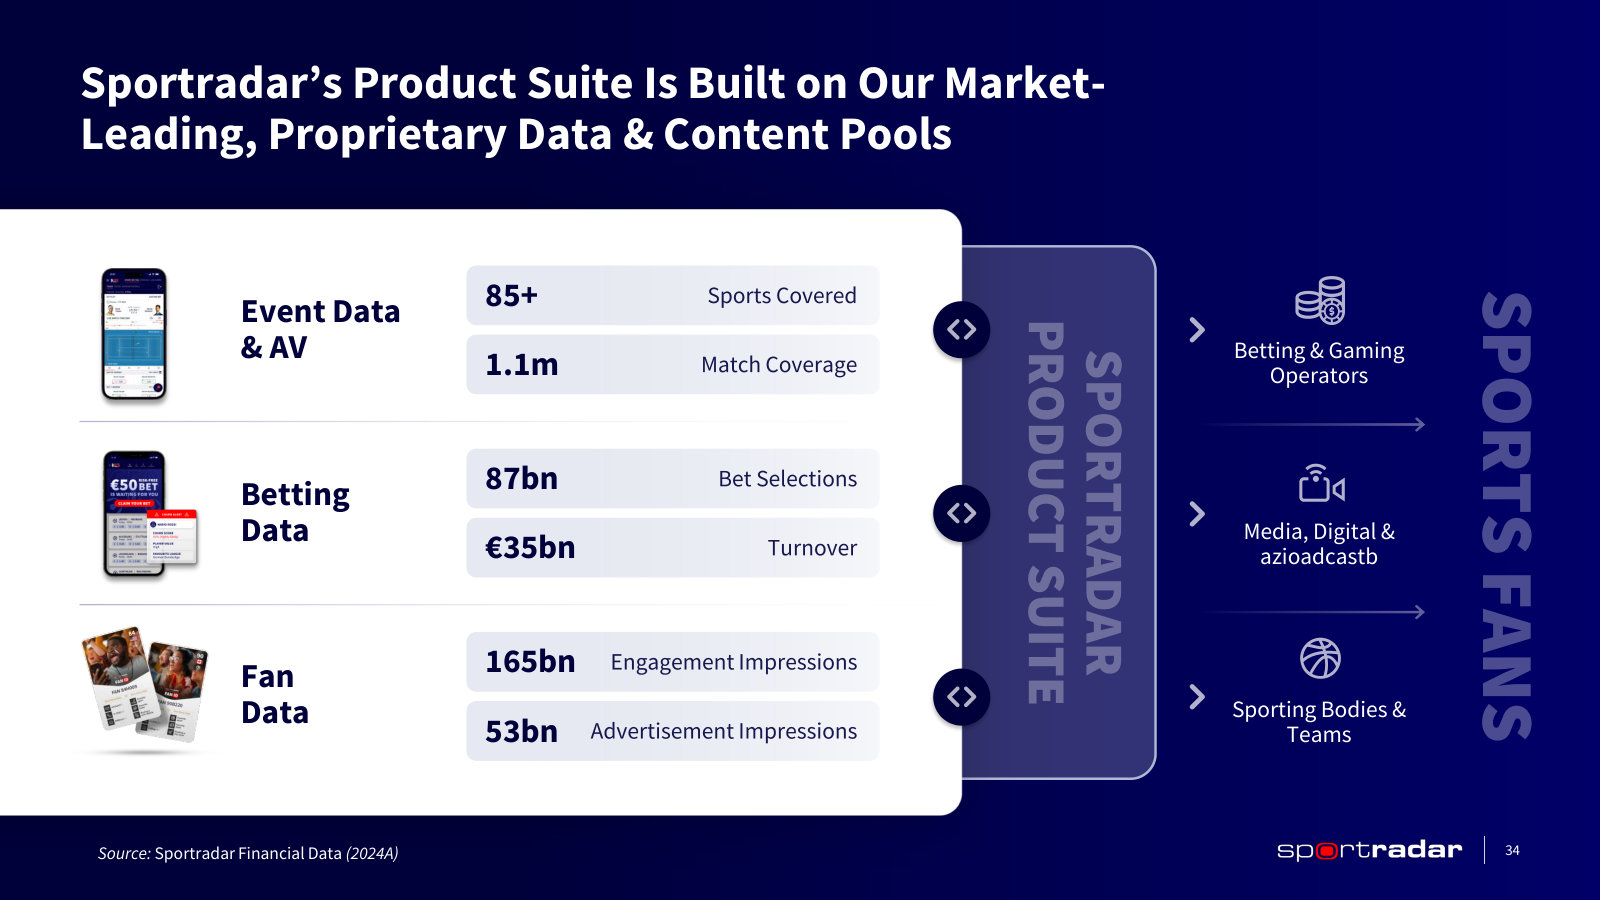
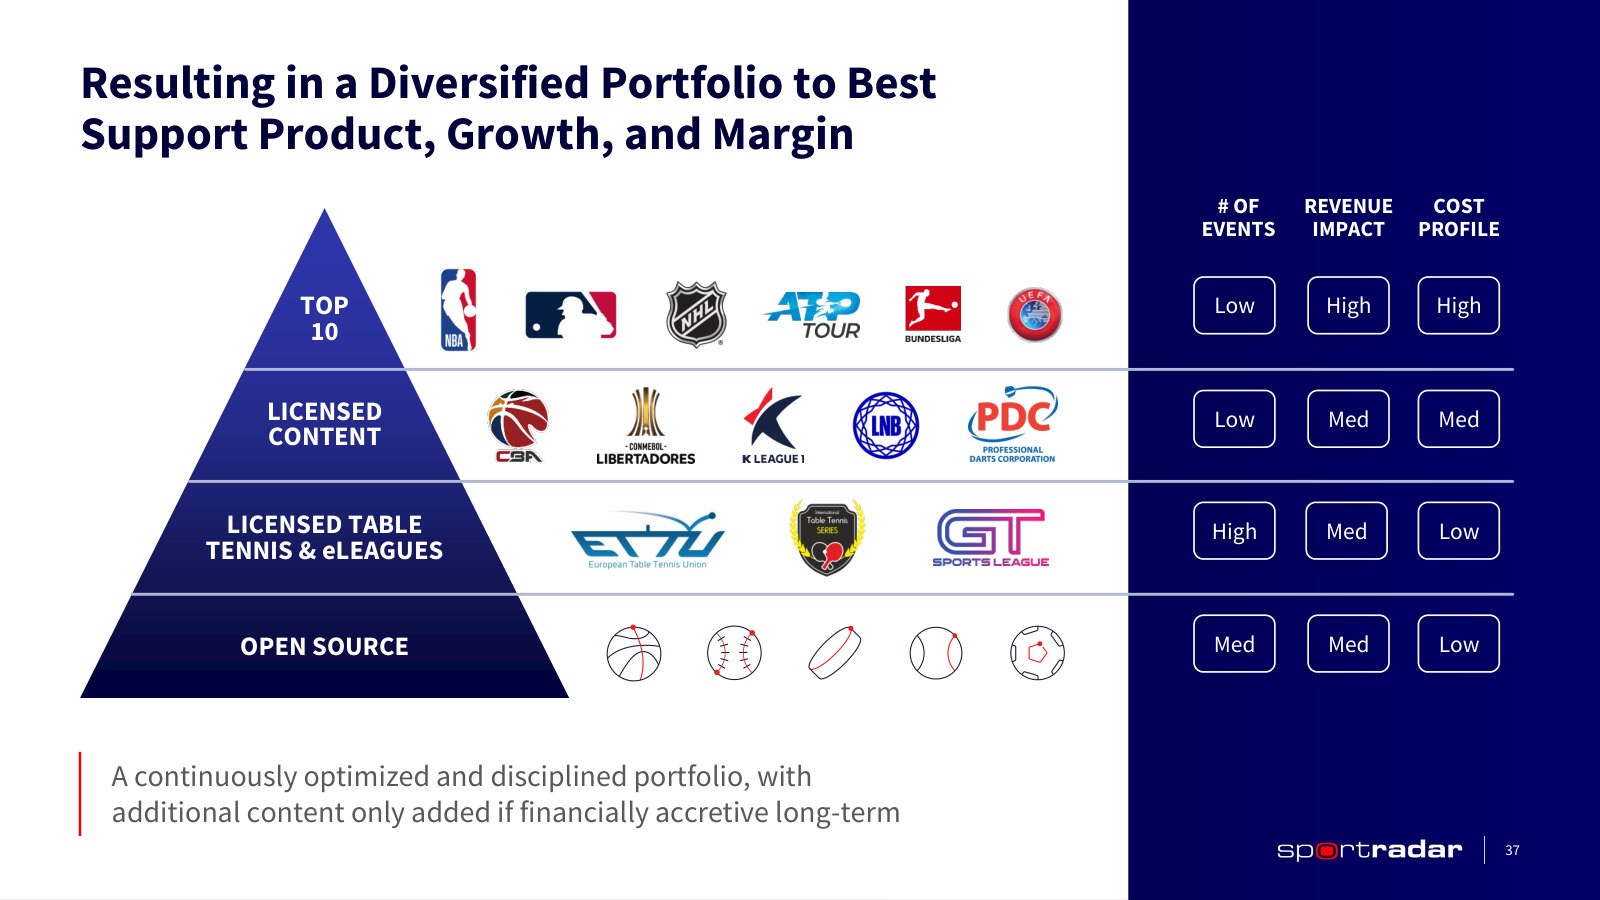
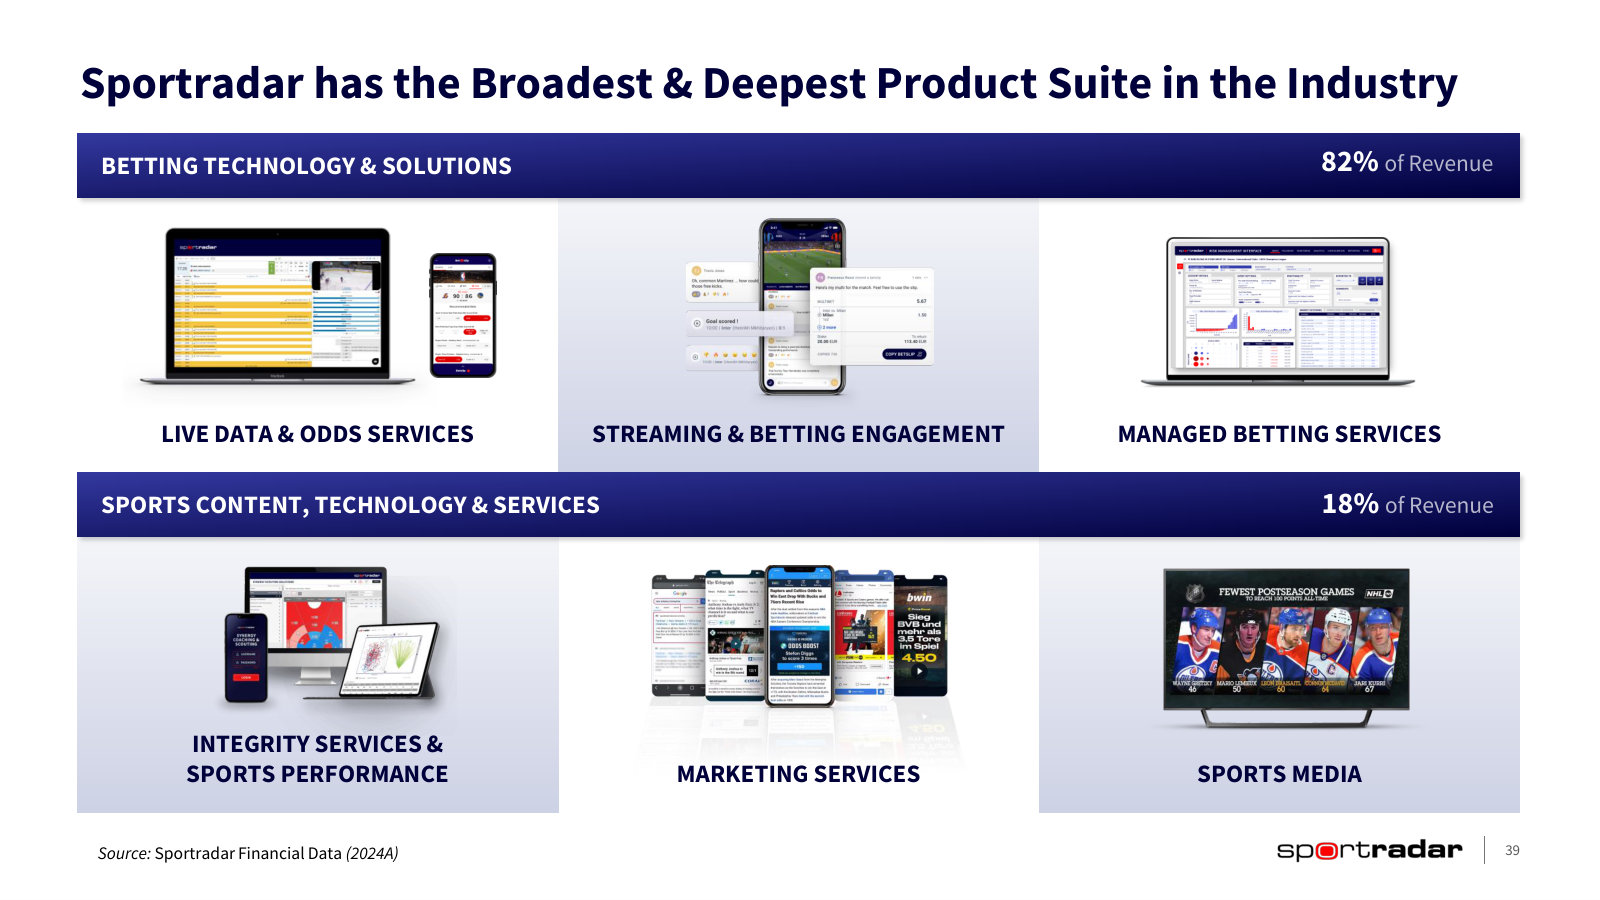
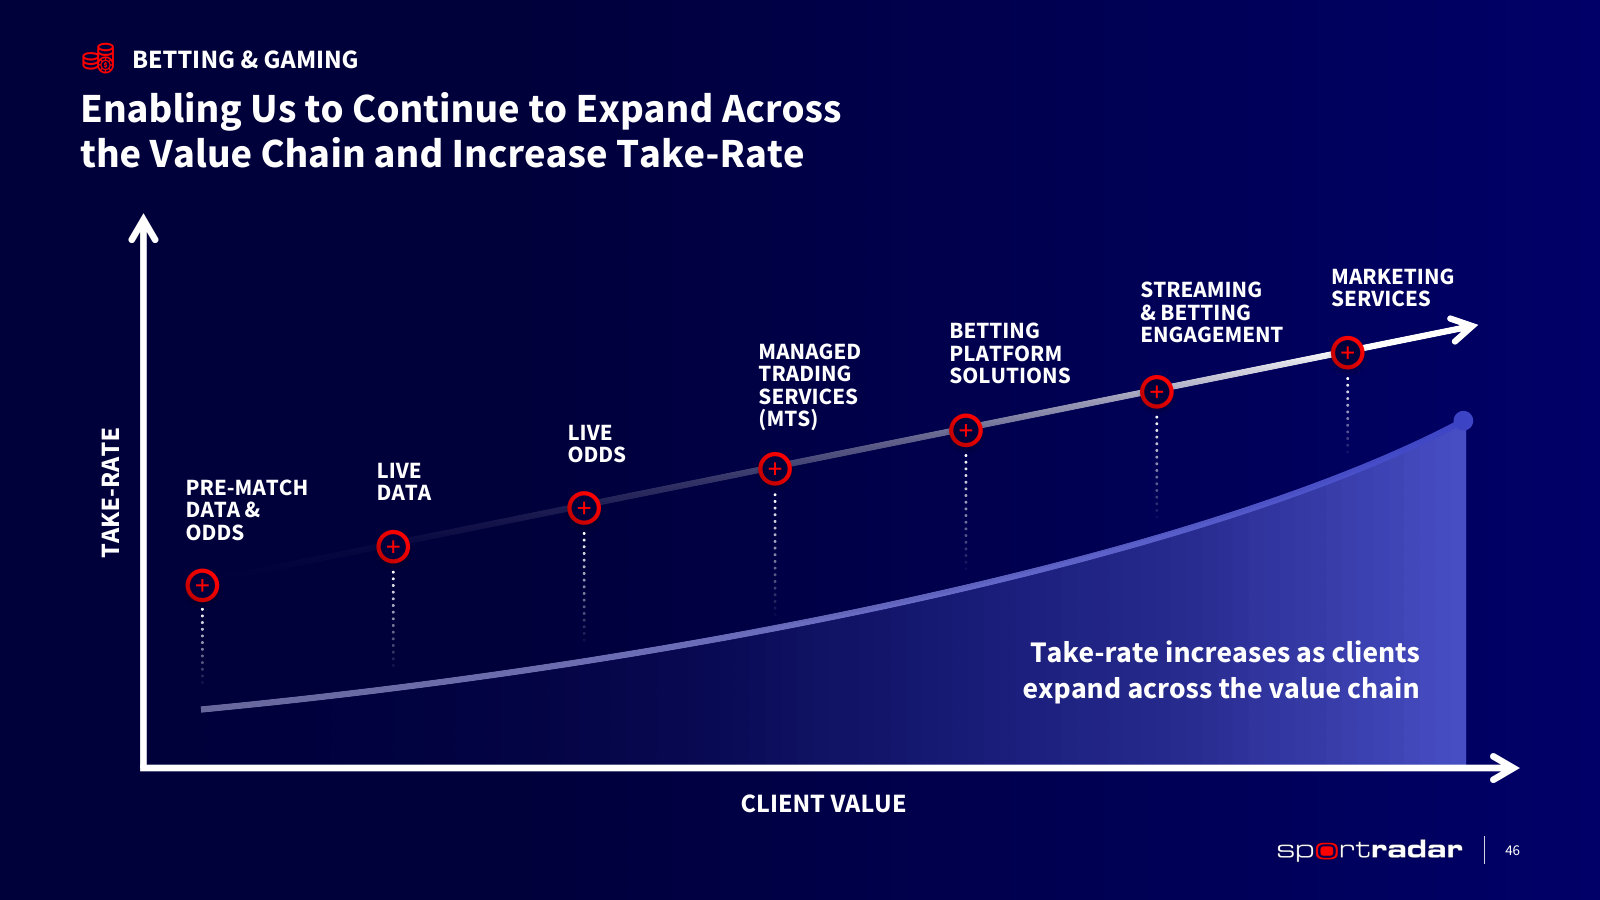
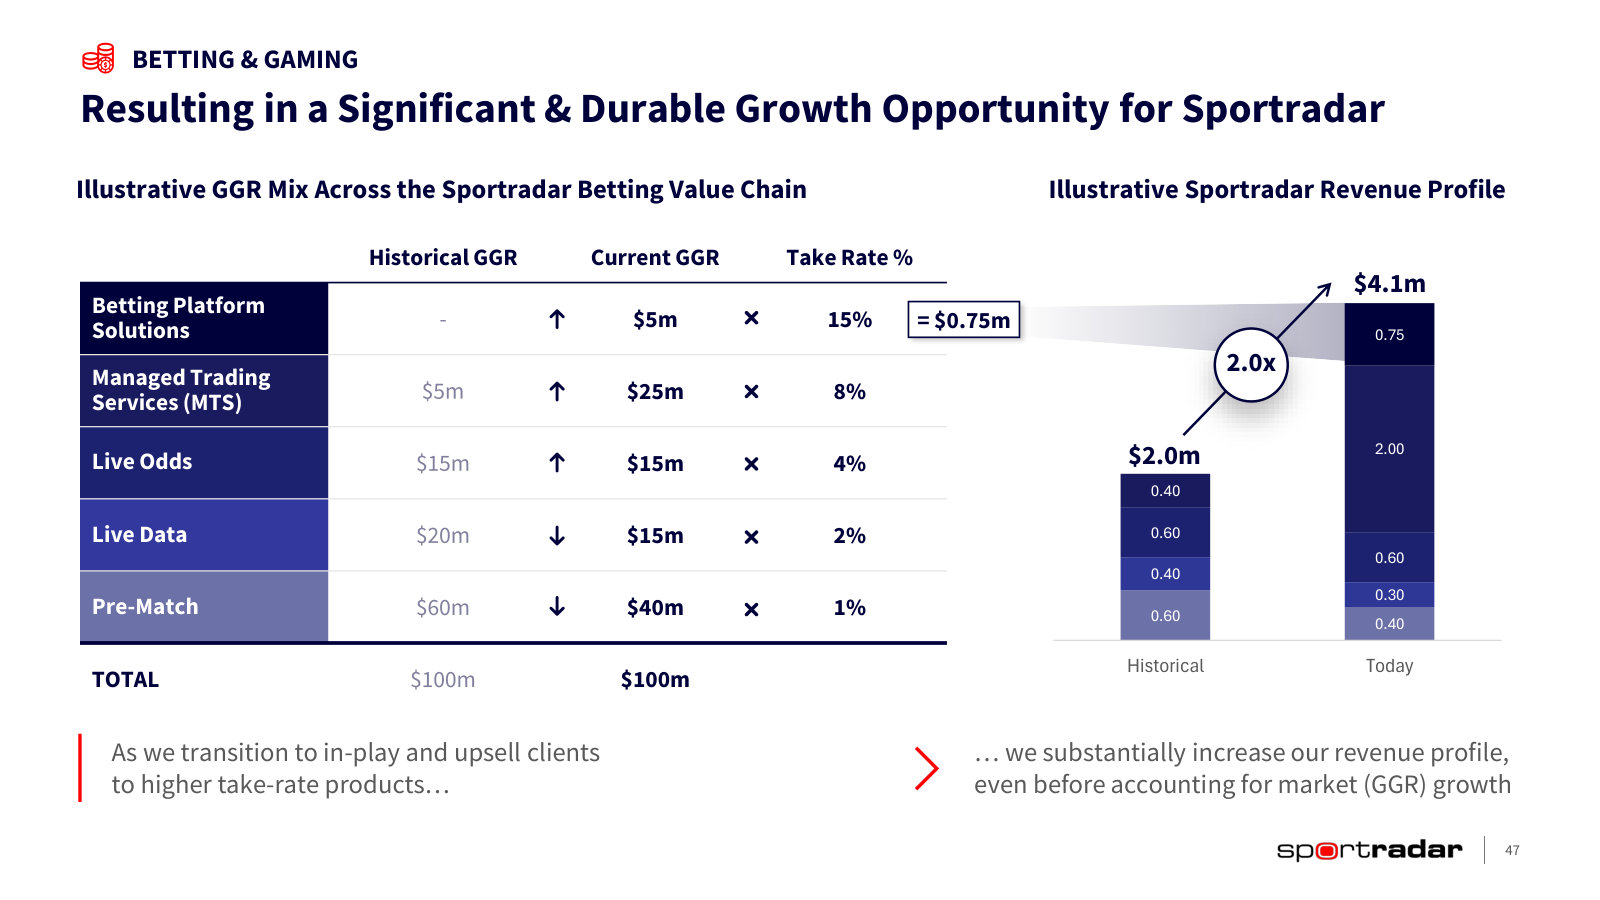
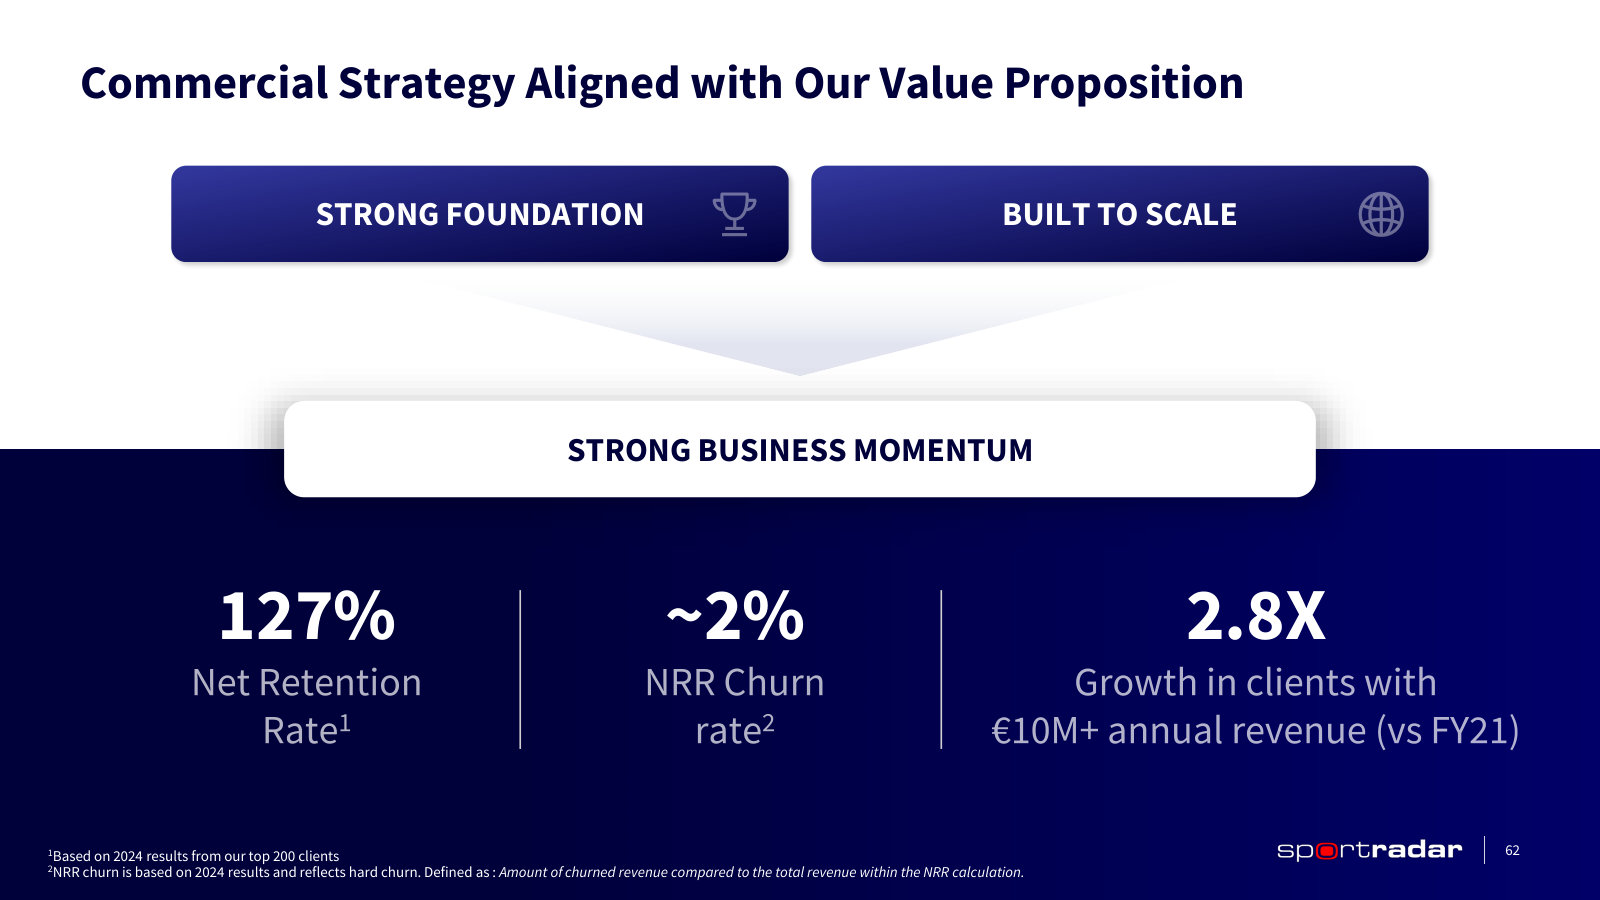
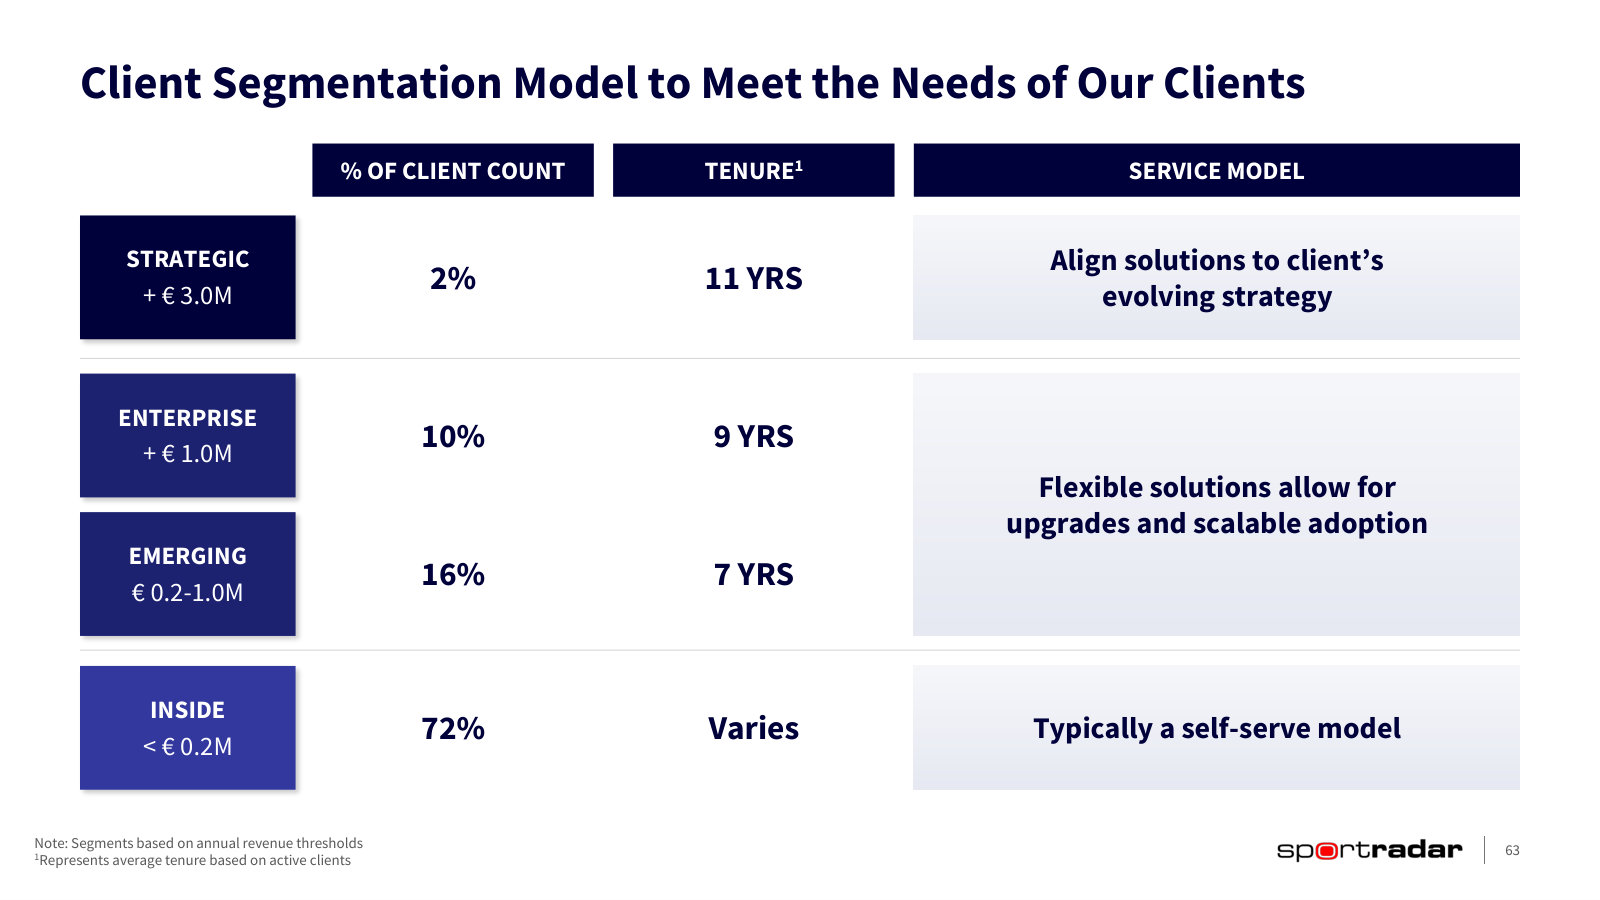
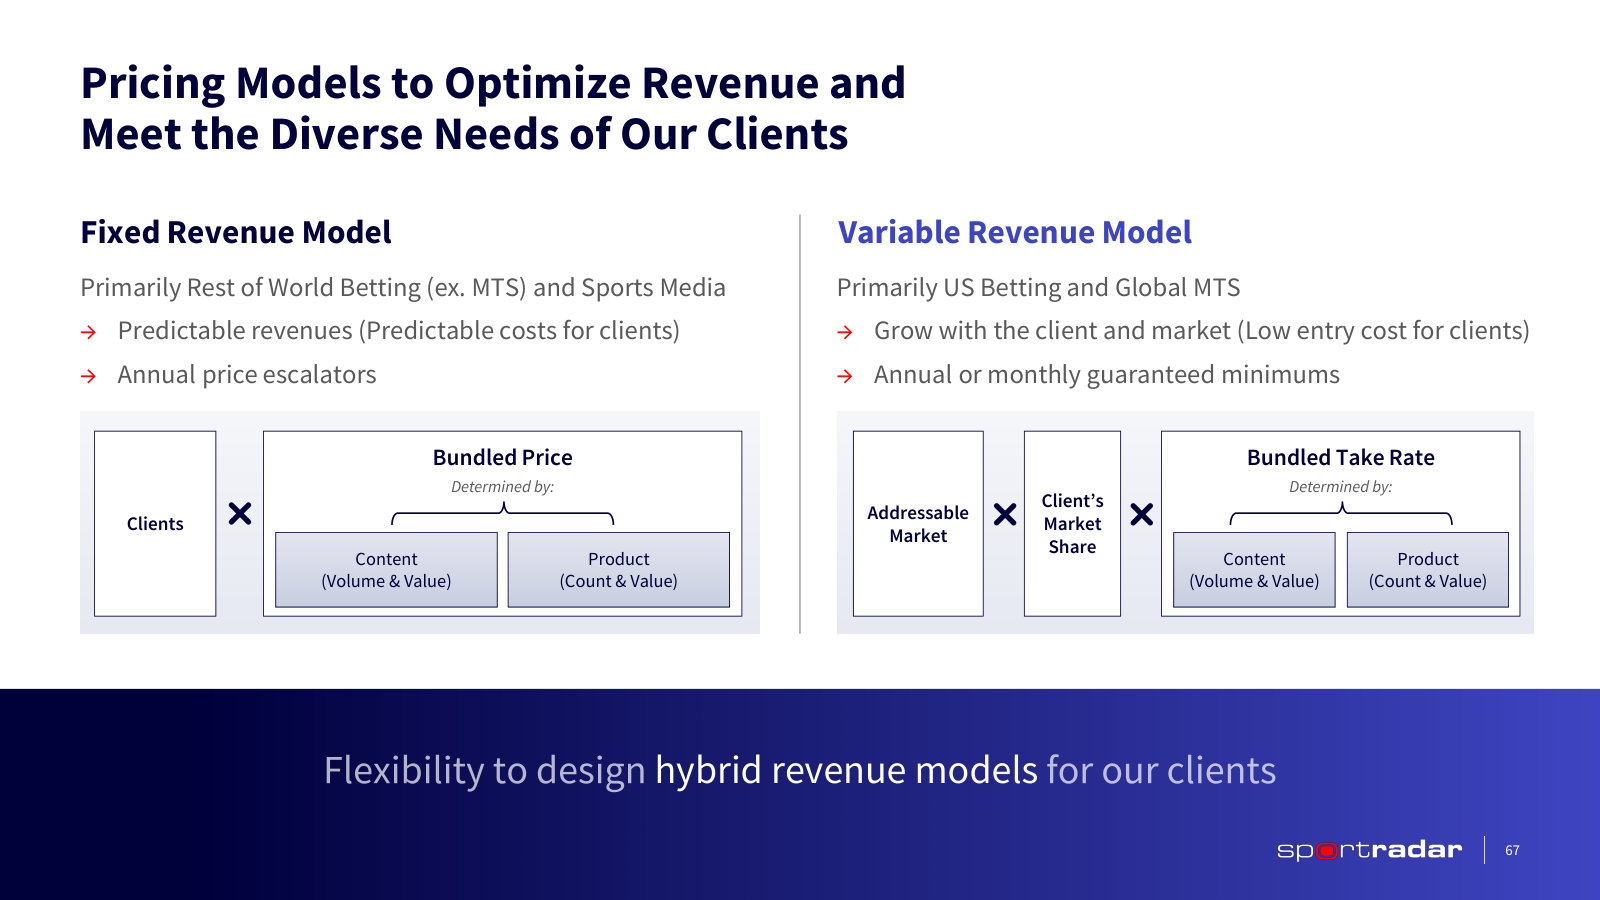
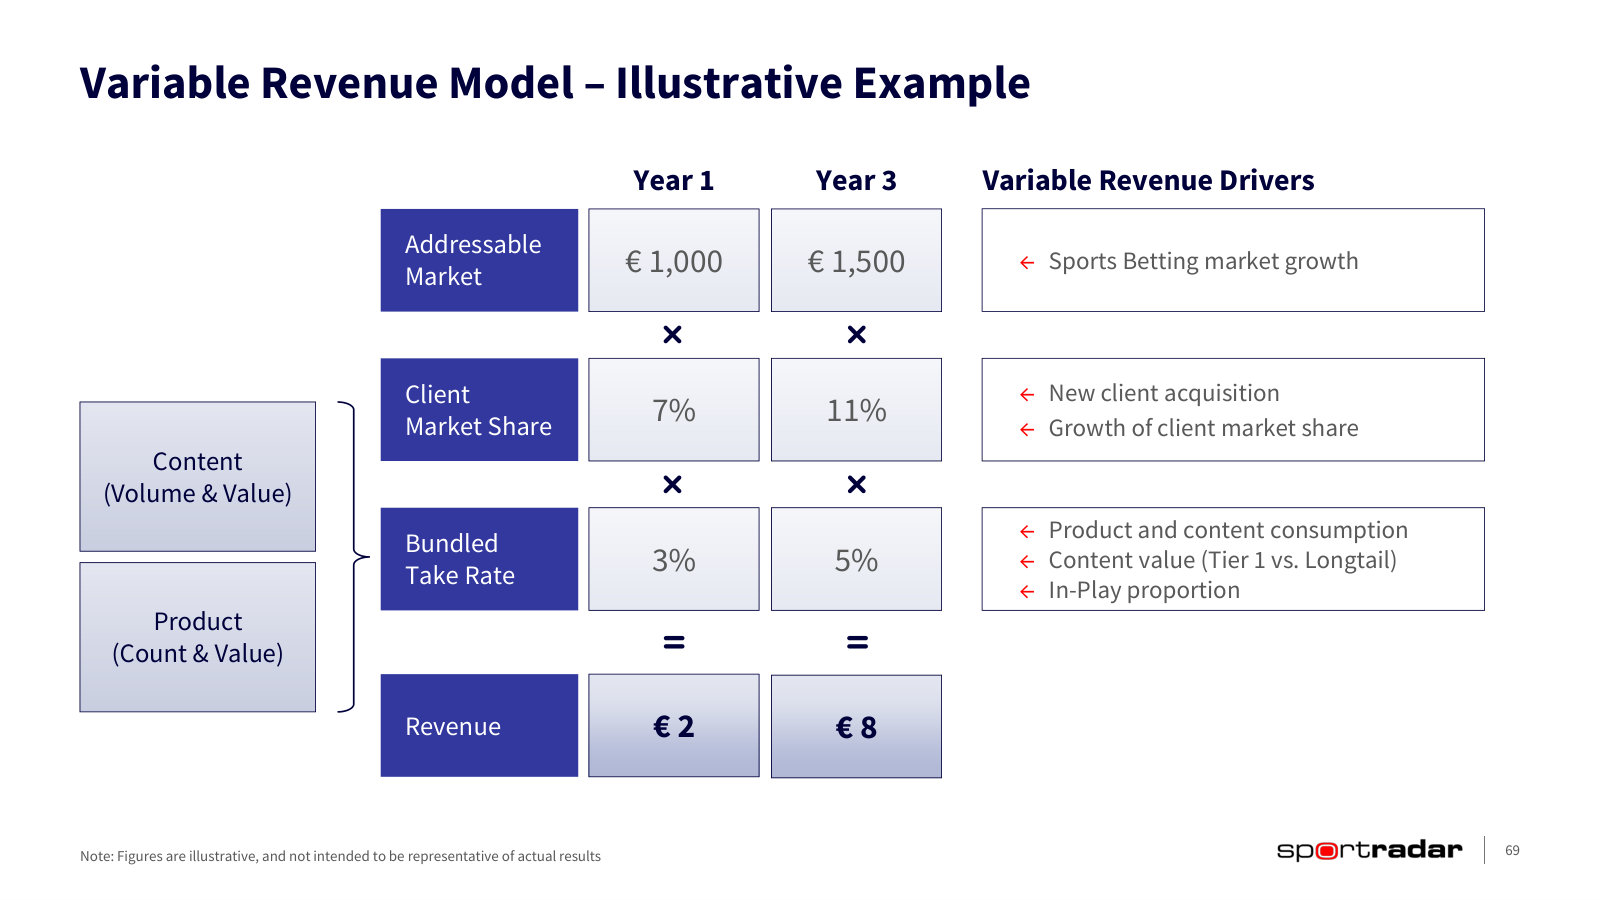
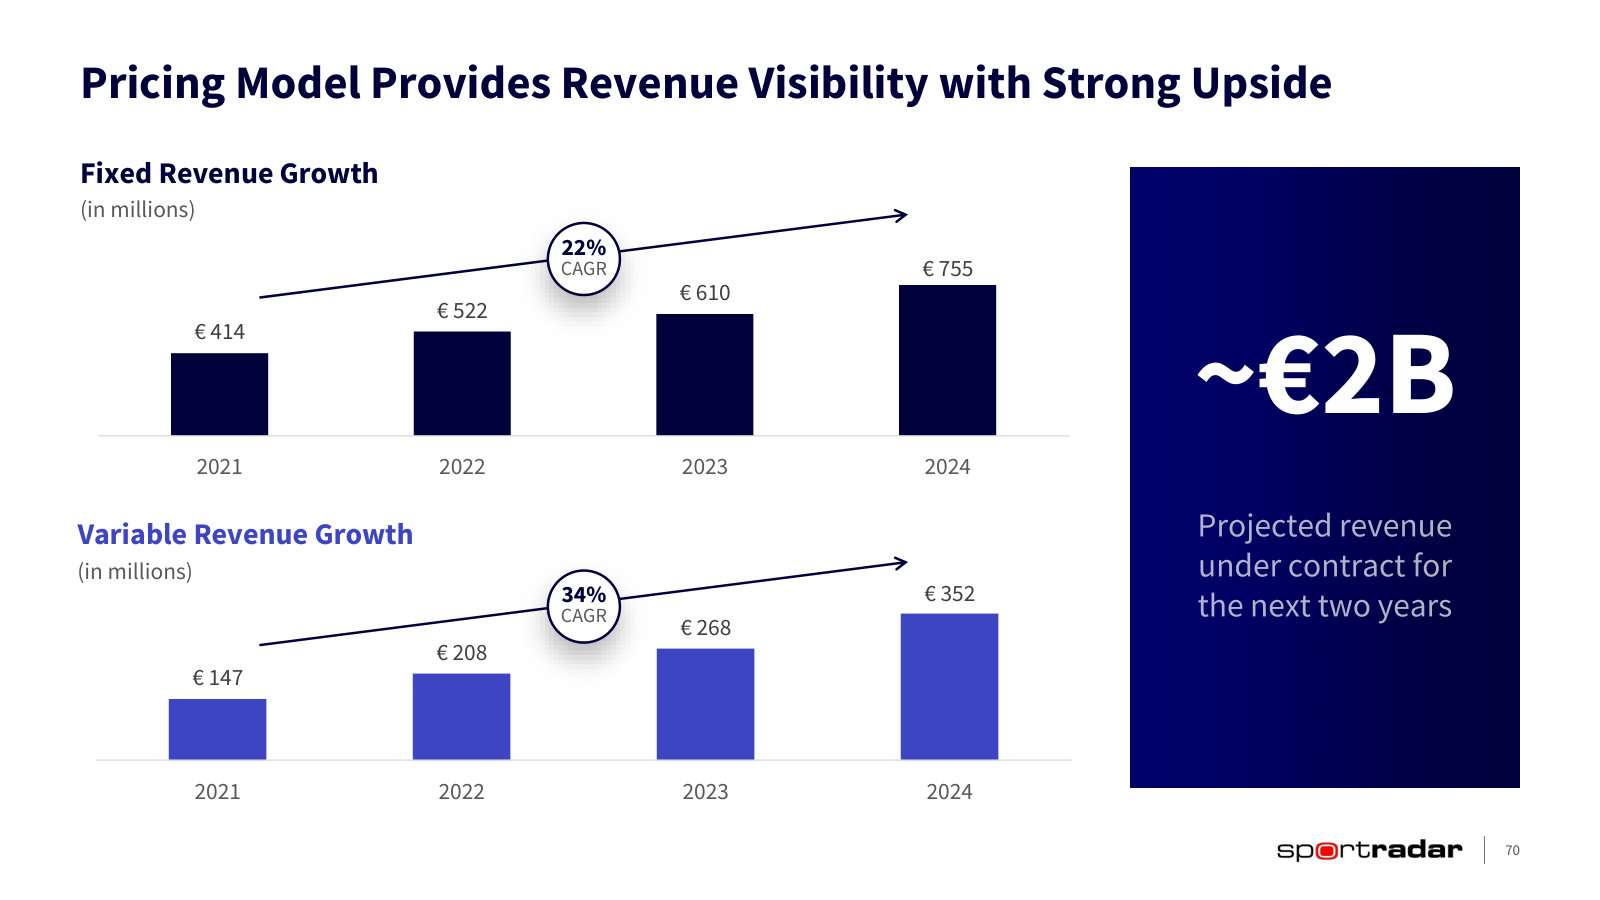
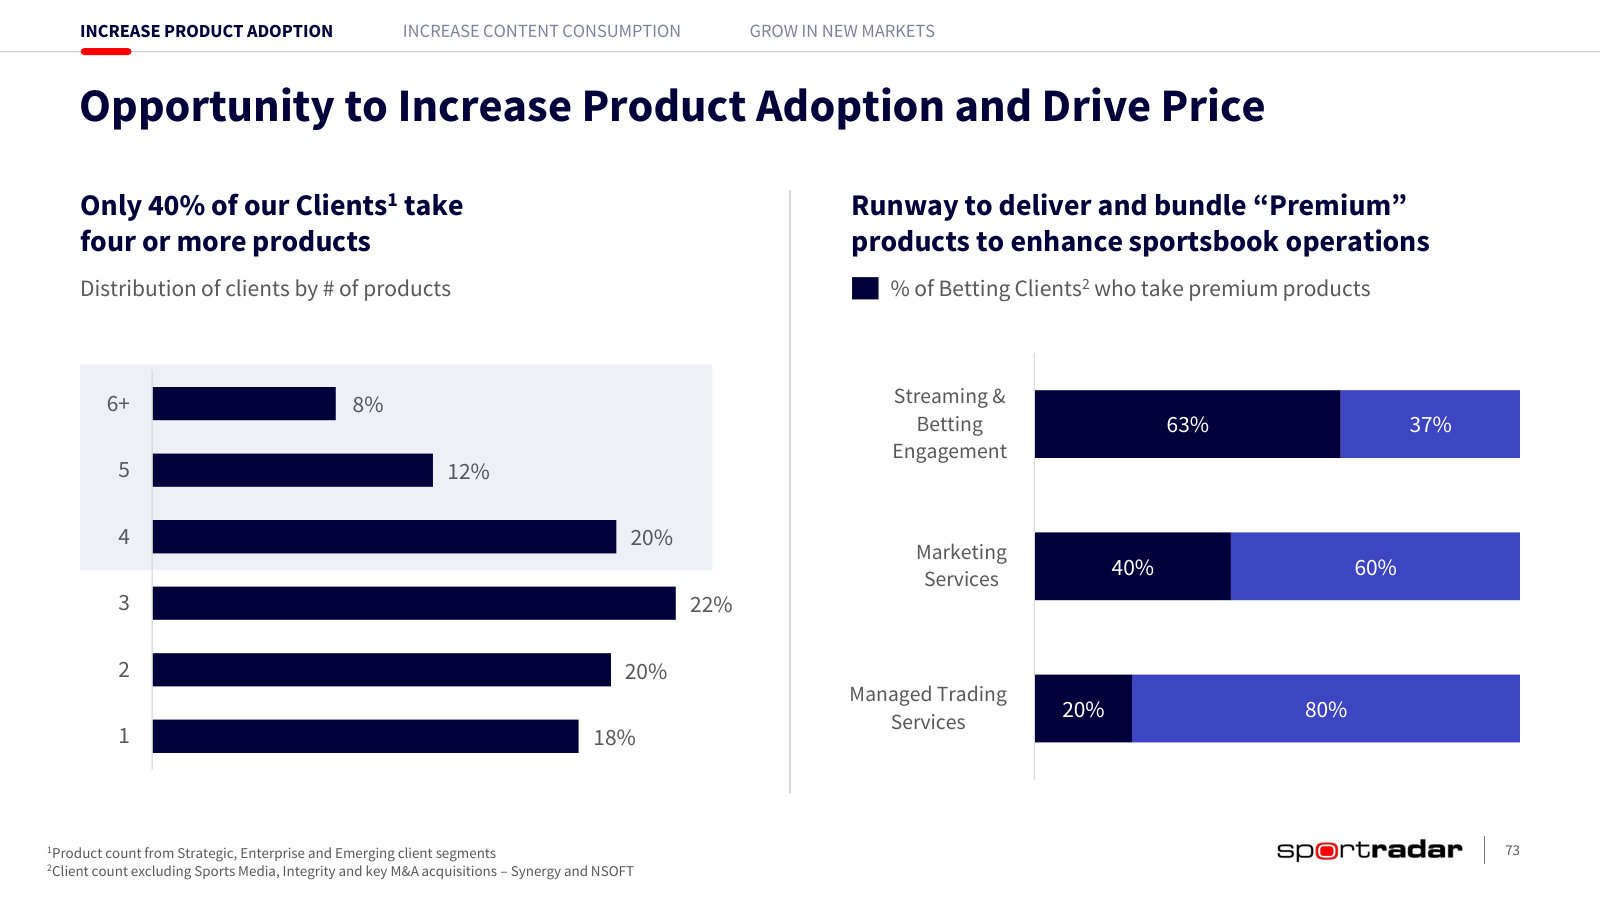
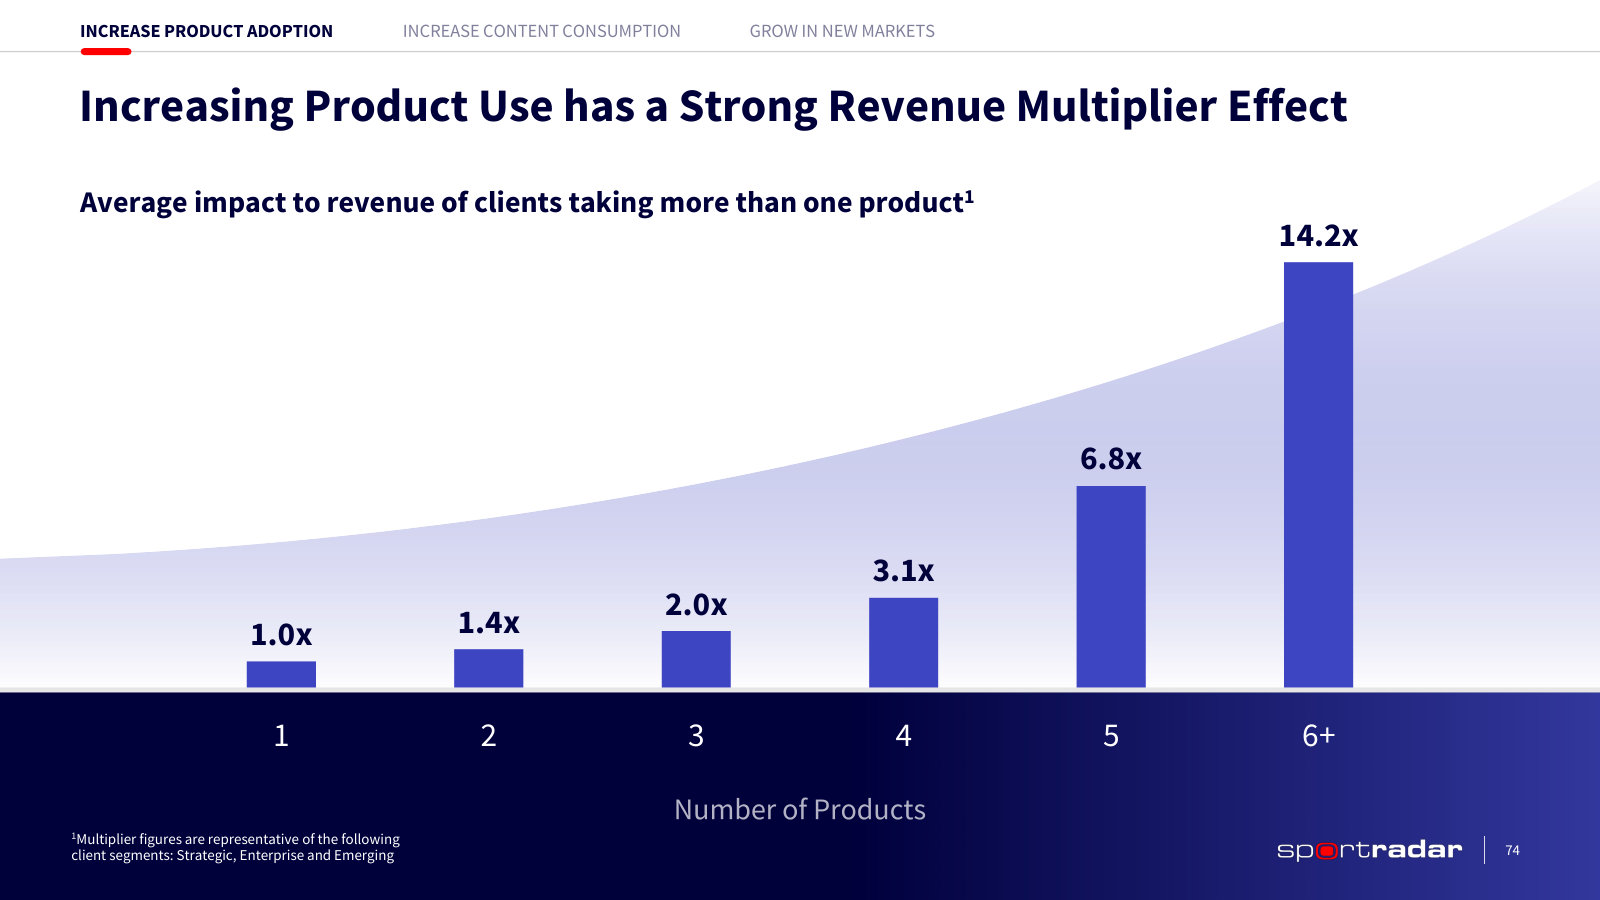
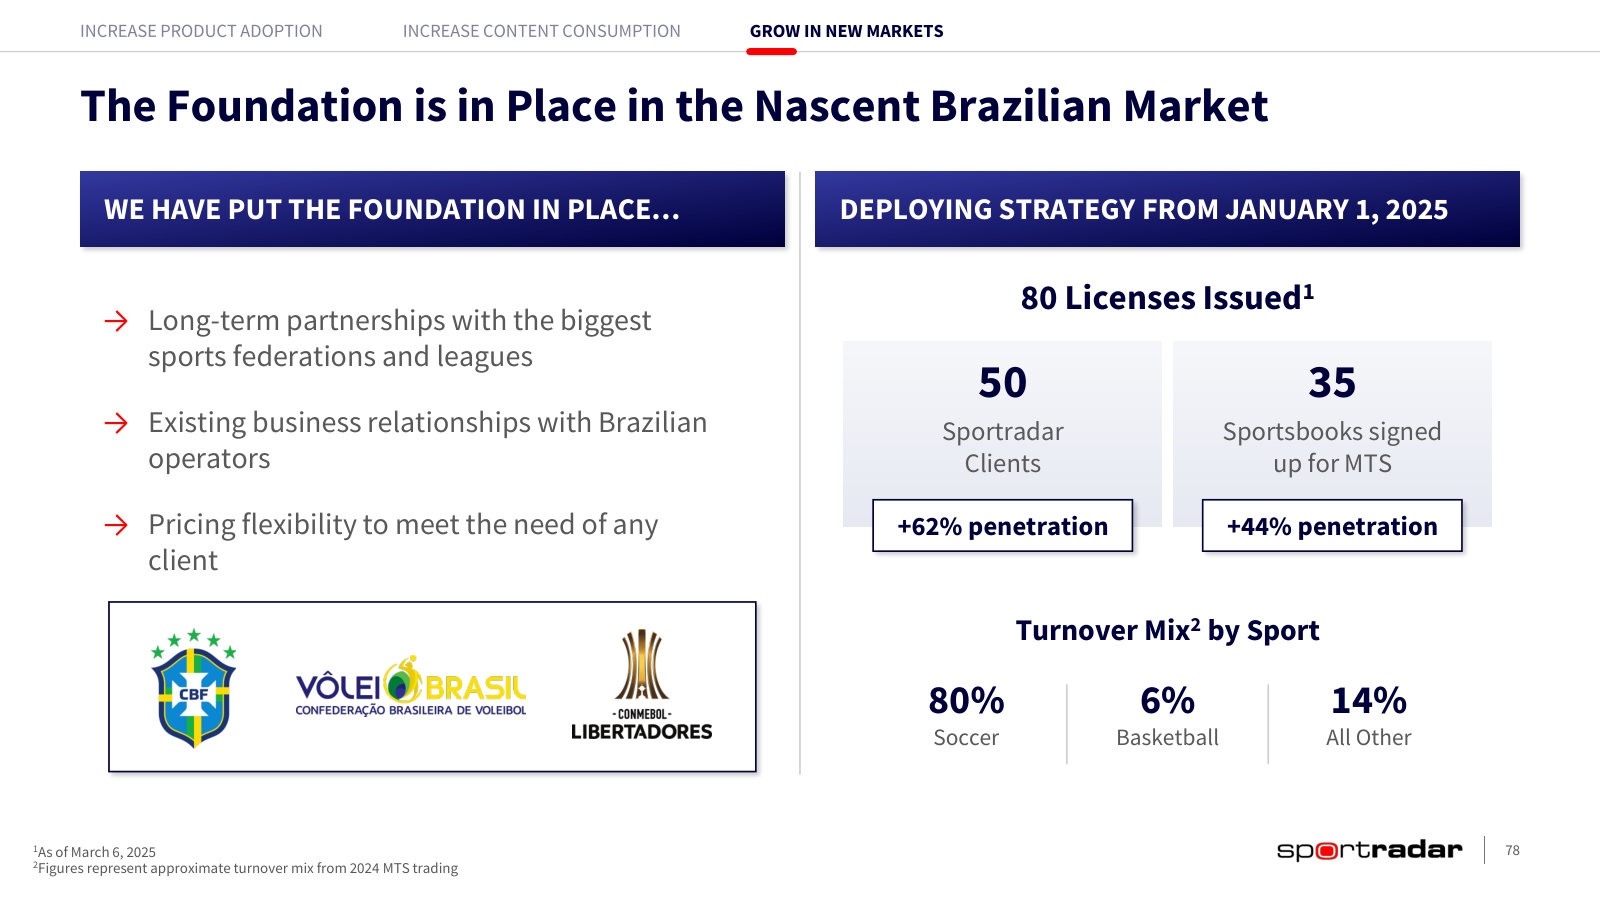
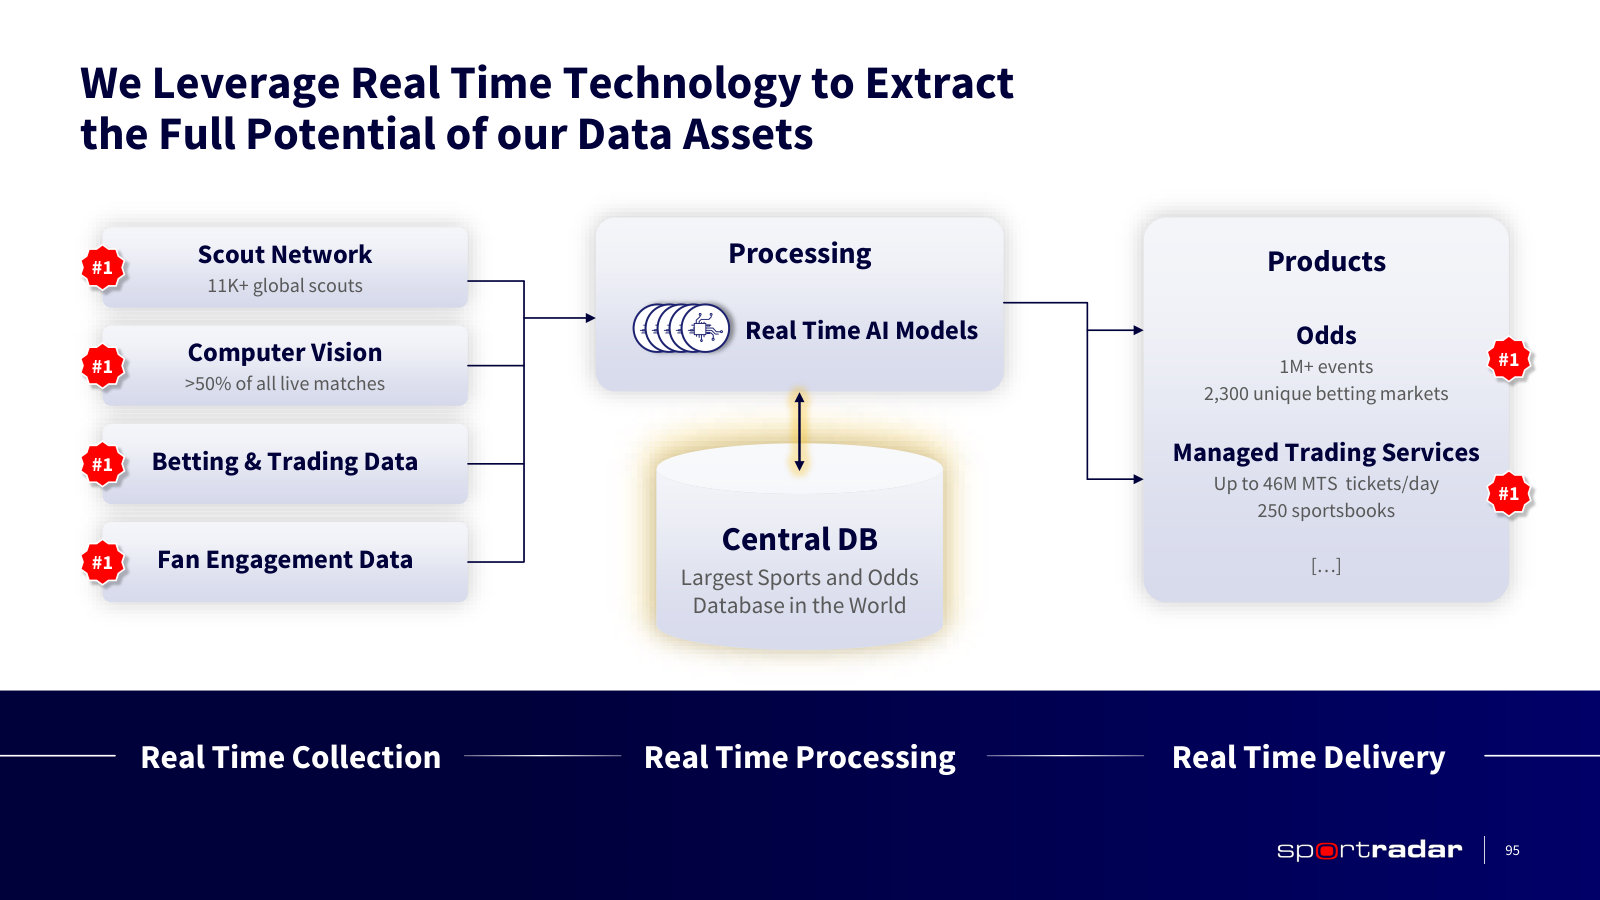
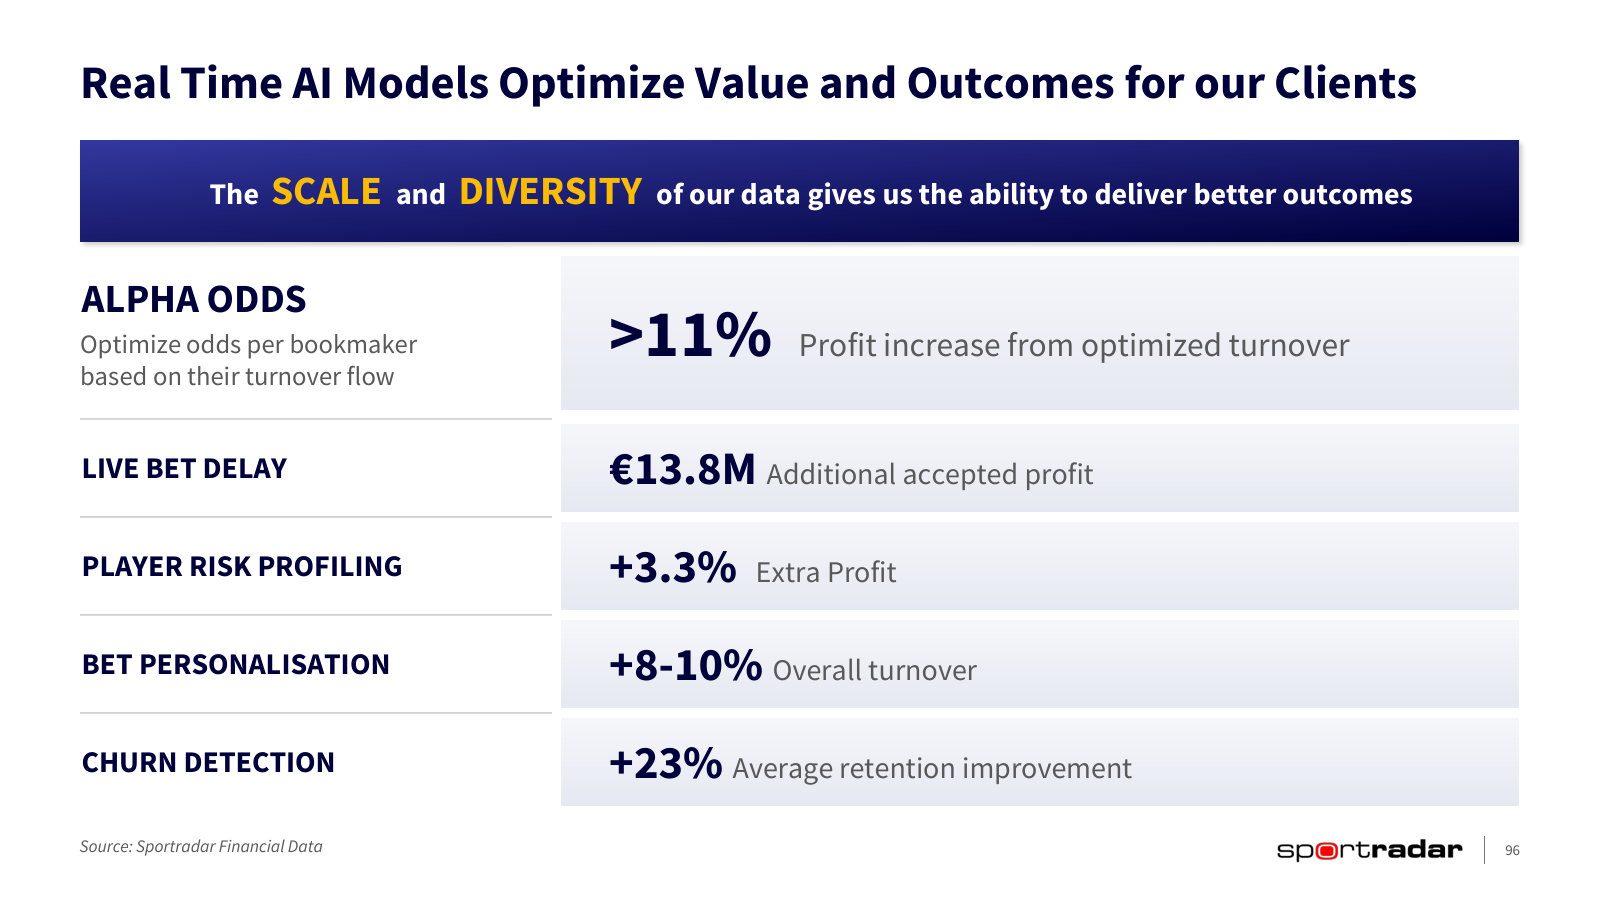
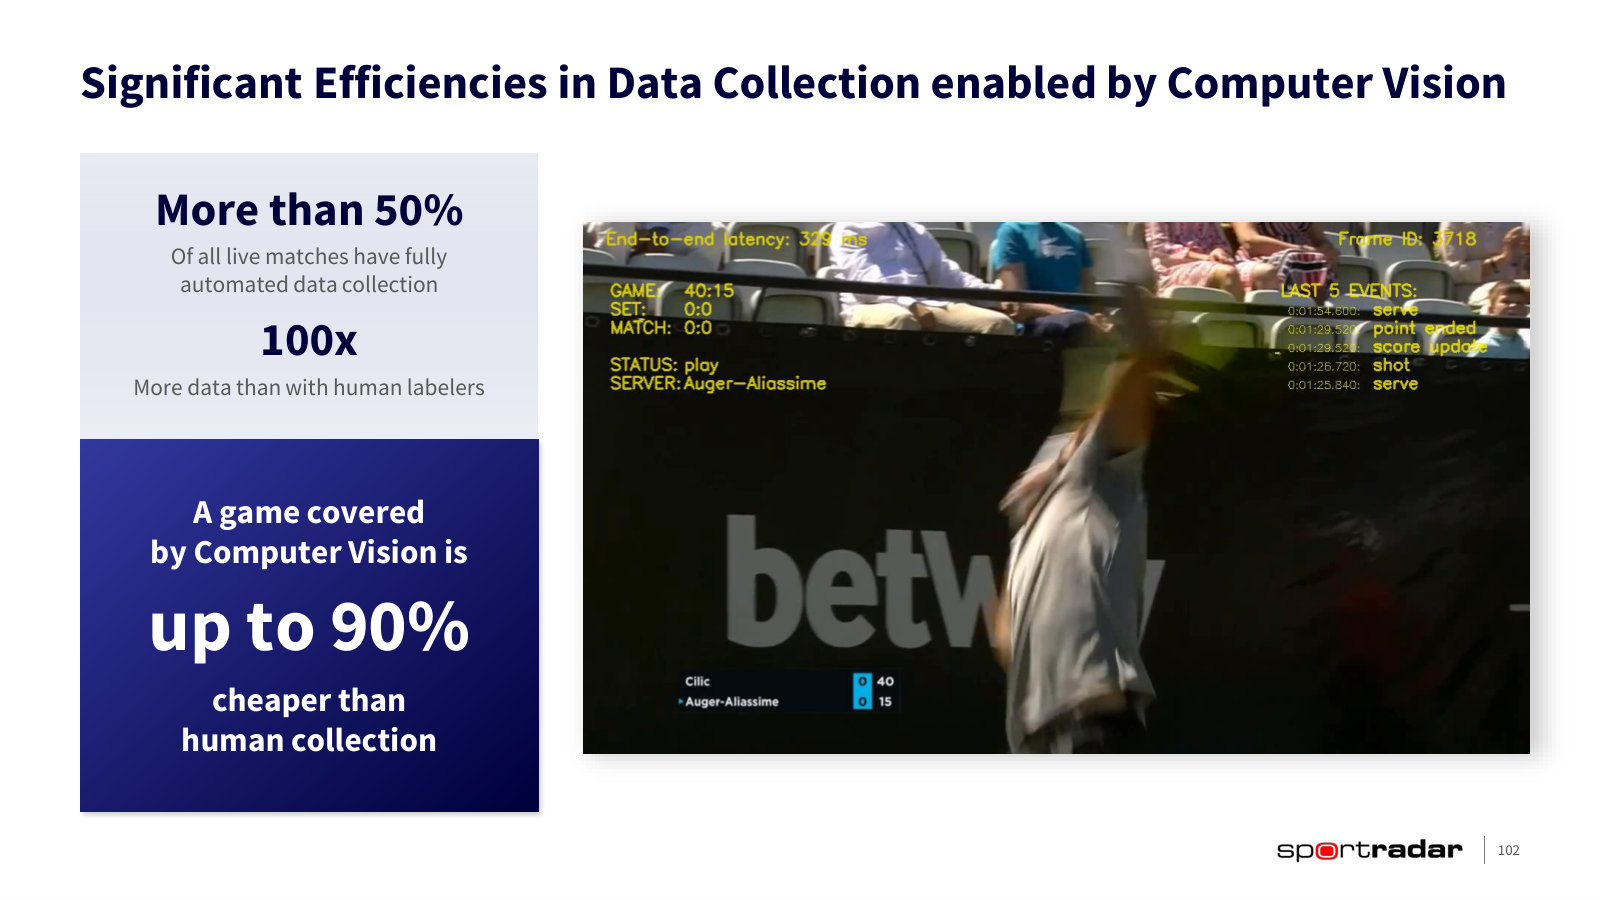
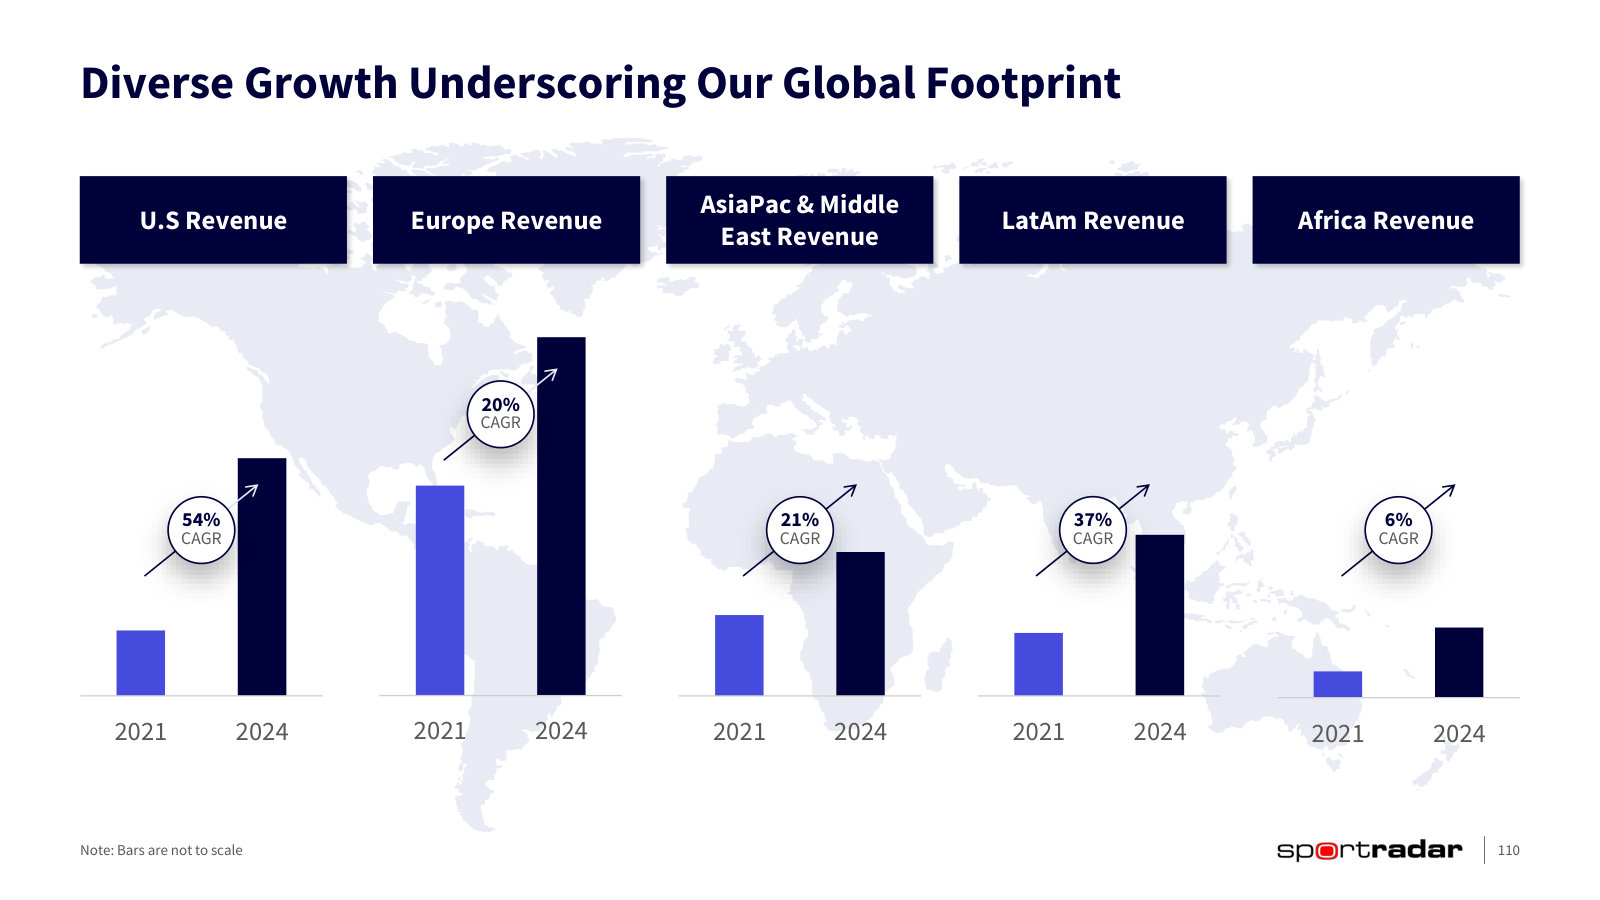
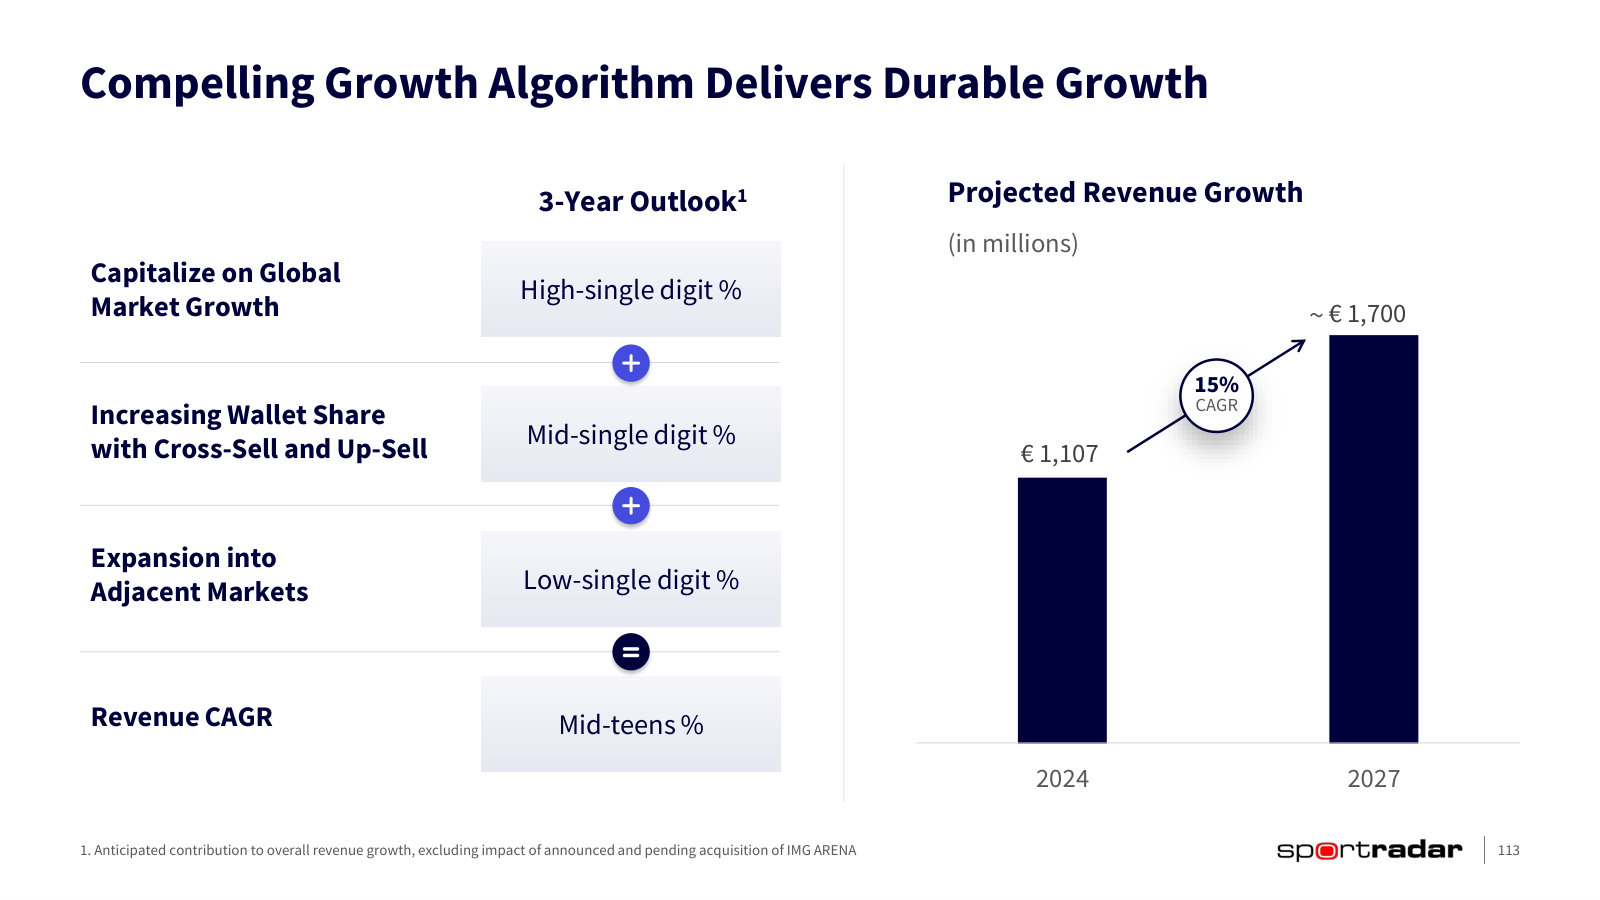
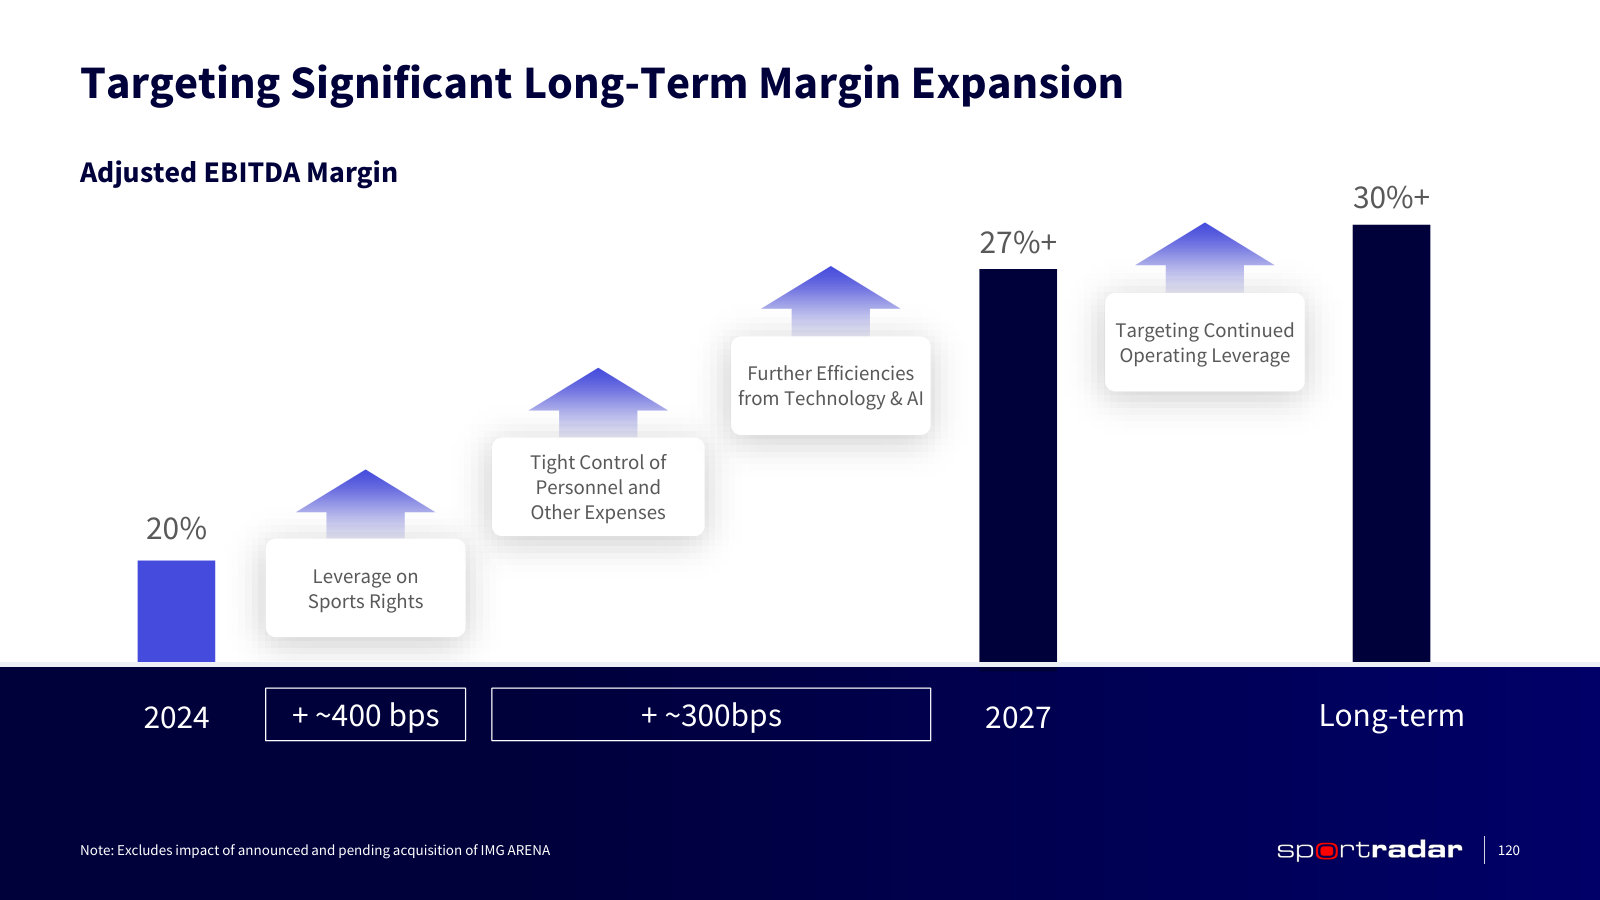
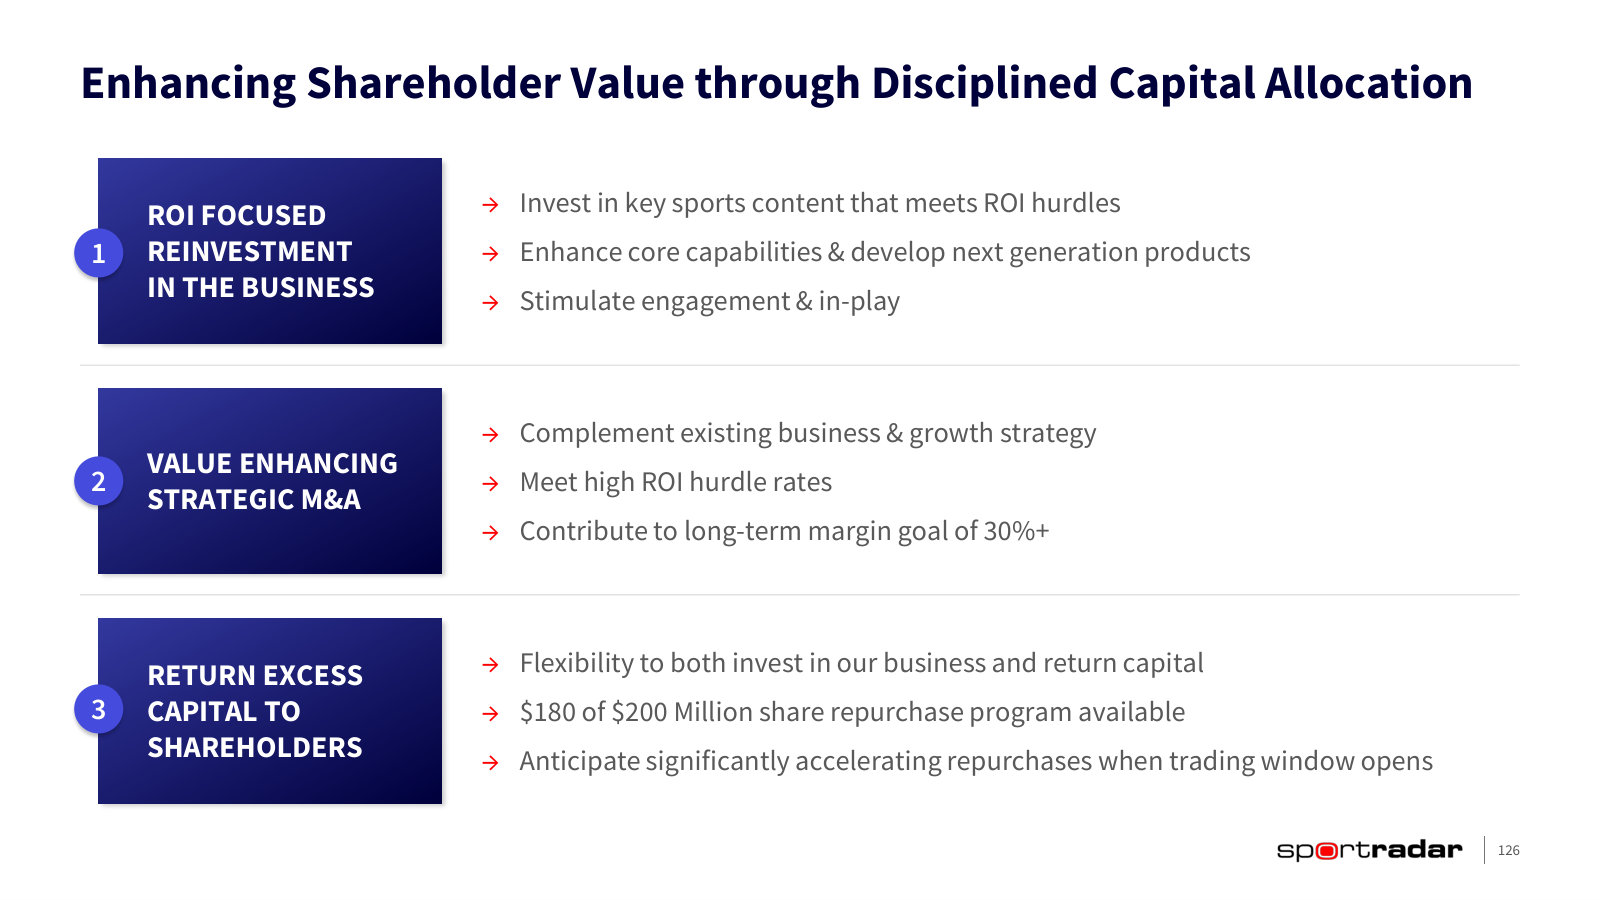
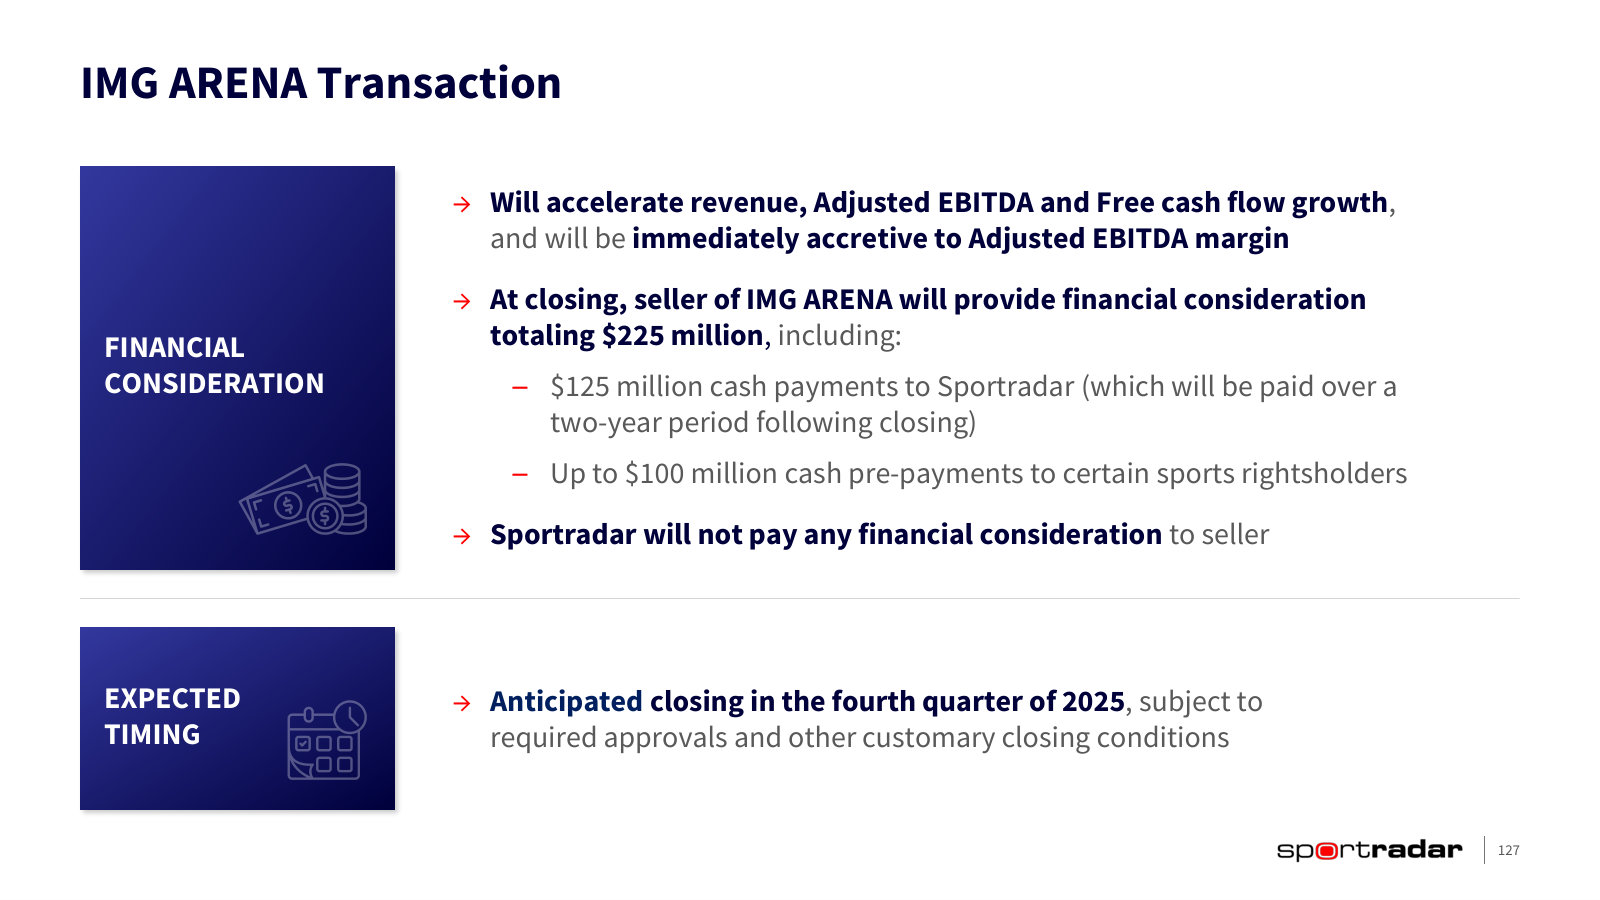
p. 8 — The business in numbers: 85+ sports, 1m+ matches a year, 800 betting operators, 900 media companies, 400 leagues and federations. · Open the full presentation →p. 9 — How the company describes its own value chain — collect, innovate, distribute, monetize, expand, perform. · Open the full presentation →p. 10 — Revenue from €0.5m in 2001 to €1.1bn in 2024, mapped against the product launched in each period. · Open the full presentation →p. 11 — The product line-up split across the two reporting segments, with what each product actually does. · Open the full presentation →p. 12 — Who buys: named betting operators, media platforms and leagues, grouped by the three customer types. · Open the full presentation →p. 15 — Management's own scorecard against two unnamed peers on content volume, product breadth and brand. · Open the full presentation →p. 16 — The six barriers to entry management claims — relationships, content, product, technology, integration, commercial reach. · Open the full presentation →p. 17 — What the IMG ARENA acquisition adds: 14 sports, 70+ rightsholders, and the tennis and golf properties it did not hold. · Open the full presentation →p. 20 — The addressable market by region — $94bn of betting GGR in 2024 growing to ~$150bn by 2029, North America fastest. · Open the full presentation →p. 22 — Where 2021–2024 revenue growth came from, product by product; the newer products compounded at 37%. · Open the full presentation →p. 23 — In-play is 33% of US betting GGR against ~75% at maturity; each point of share is worth ~€6m of revenue a year. · Open the full presentation →p. 24 — The iGaming adjacency: a ~$10bn marketing TAM, of which management claims ~$2bn is realistically addressable. · Open the full presentation →p. 25 — The platform framing — data and content suppliers on one side, operators, media and federations on the other. · Open the full presentation →p. 28 — The three-year targets set at this event: ~€1.7bn revenue, ~€455m adjusted EBITDA, ~€275m free cash flow by 2027. · Open the full presentation →p. 34 — The three proprietary data pools — event, betting and fan data — that everything else is built on, with 2024 volumes. · Open the full presentation →p. 37 — Content tiered by cost and revenue impact, from the top-10 leagues down to open-source coverage. · Open the full presentation →p. 39 — The two segments sized: betting technology is 82% of revenue, sports content and services 18%. · Open the full presentation →p. 46 — Take rate rises as a client moves up from pre-match data to managed trading, platform and marketing services. · Open the full presentation →p. 47 — The unit economics in one page: the same $100m of client GGR yields twice the revenue as mix shifts to higher take-rate products. · Open the full presentation →p. 62 — Retention economics — 127% net revenue retention on the top 200 clients and roughly 2% hard churn. · Open the full presentation →p. 63 — The client base by tier: 2% of clients are 'strategic' at over €3m a year; 72% are self-serve. · Open the full presentation →p. 67 — The two pricing models — fixed bundled fees across most of the world, variable take rate in the US and global MTS. · Open the full presentation →p. 69 — The variable model worked through: market size × client share × take rate, and what moves each term. · Open the full presentation →p. 70 — Fixed and variable revenue growth side by side, with ~€2bn of revenue already under contract for two years. · Open the full presentation →p. 73 — The upsell runway: only 40% of clients take four or more products, and 80% take no managed trading. · Open the full presentation →p. 74 — Revenue per client by product count — clients on six or more products are worth 14x a single-product client. · Open the full presentation →p. 78 — Brazil as the worked example of entering a newly regulated market: 50 clients and 35 MTS sportsbooks at launch. · Open the full presentation →p. 95 — The production pipeline end to end: 11k scouts and computer vision feeding a central database, then out to products. · Open the full presentation →p. 96 — What the AI models are worth to clients — odds optimisation, bet delay, risk profiling, each with a claimed uplift. · Open the full presentation →p. 102 — Computer vision now covers over half of live matches at up to 90% lower cost than human data collection. · Open the full presentation →p. 110 — Revenue growth by region, 2021 to 2024 — the US compounded at 54%, Europe at 20%. · Open the full presentation →p. 113 — The growth algorithm behind the 15% target: market growth, plus wallet share, plus adjacent markets. · Open the full presentation →p. 120 — The margin bridge from 20% in 2024 to 27%+ in 2027 and 30%+ long term, and what each step comes from. · Open the full presentation →p. 126 — How management says it will spend the cash: reinvestment first, then M&A, then buybacks. · Open the full presentation →p. 127 — The unusual structure of the IMG ARENA deal — Sportradar pays nothing and receives $225m from the seller. · Open the full presentation →
The most recent full-year scorecard: 2025 results, the first real read on IMG ARENA after closing, and 2026 guidance. · Open the full document →
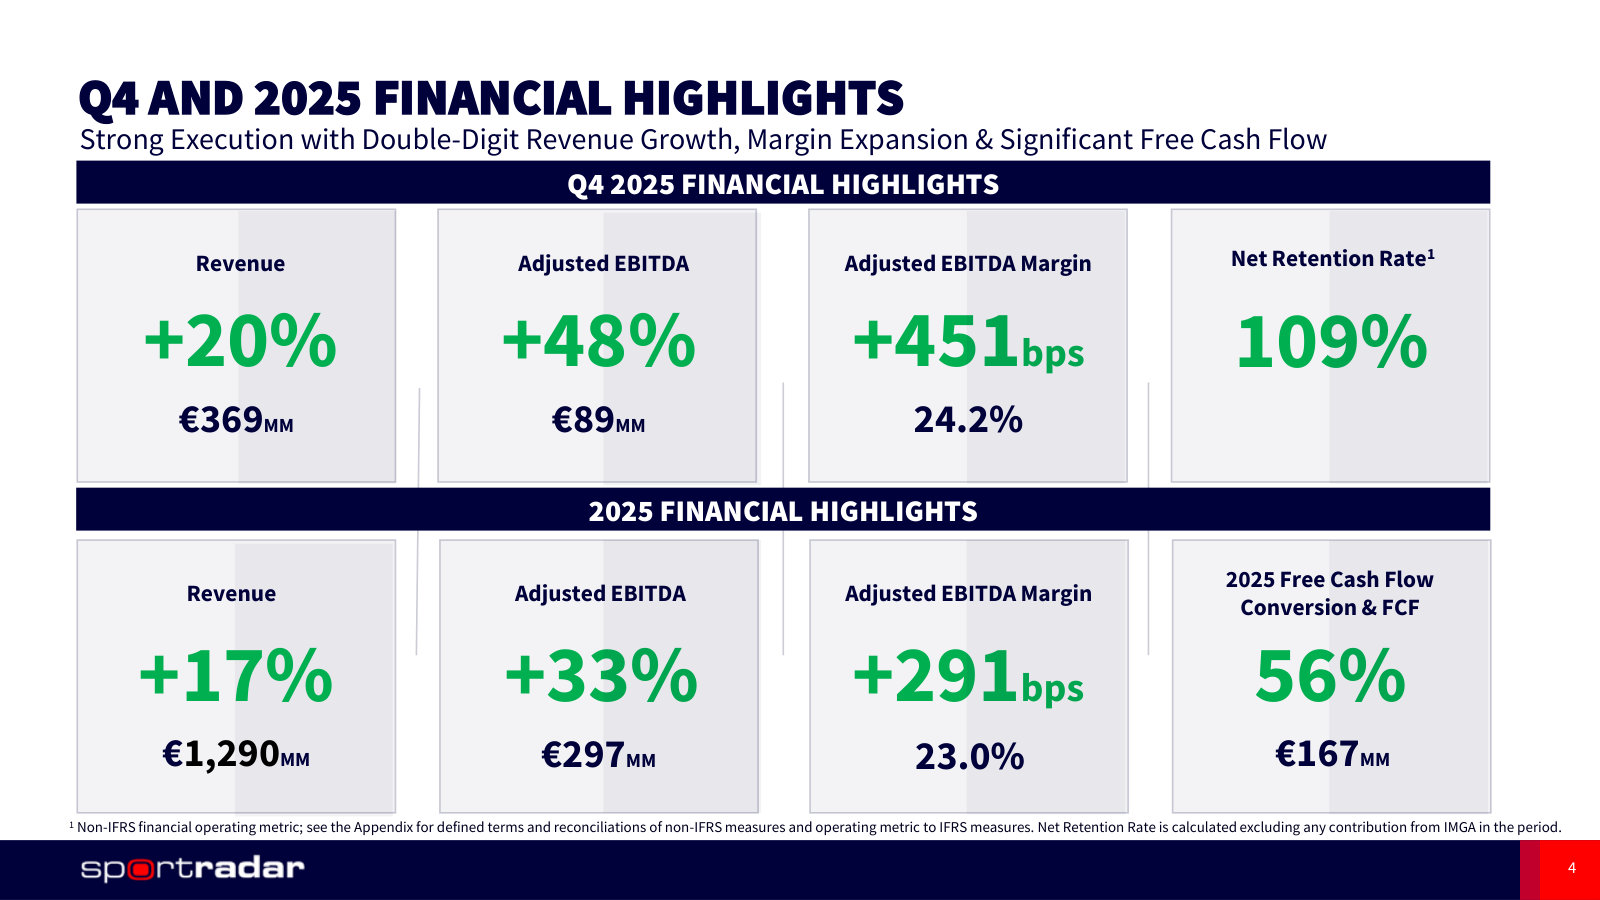
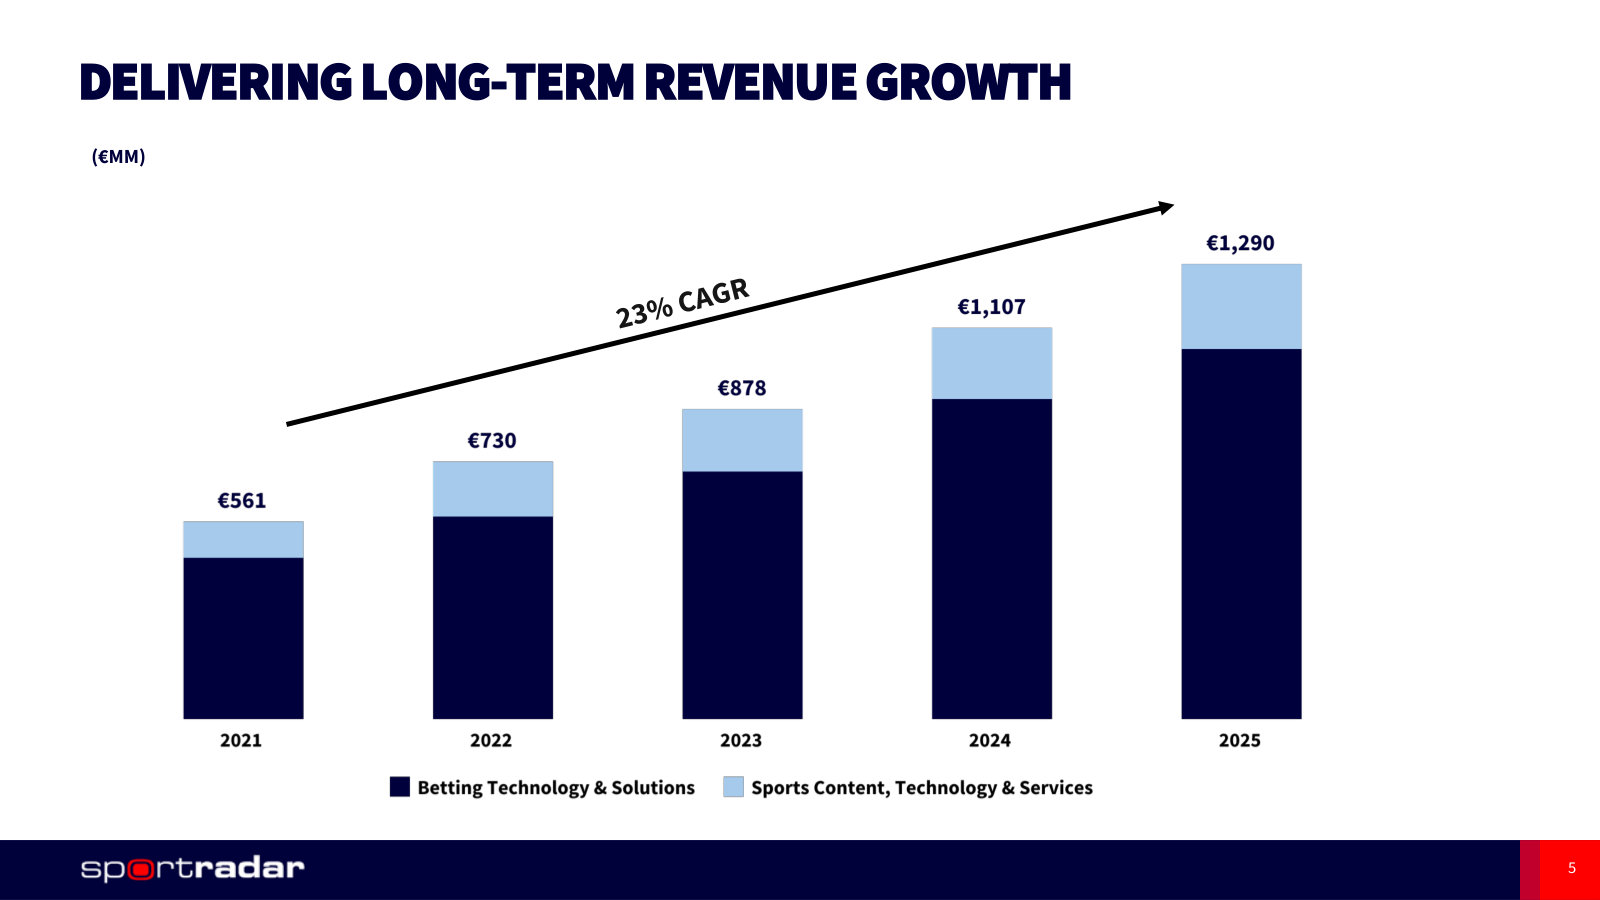
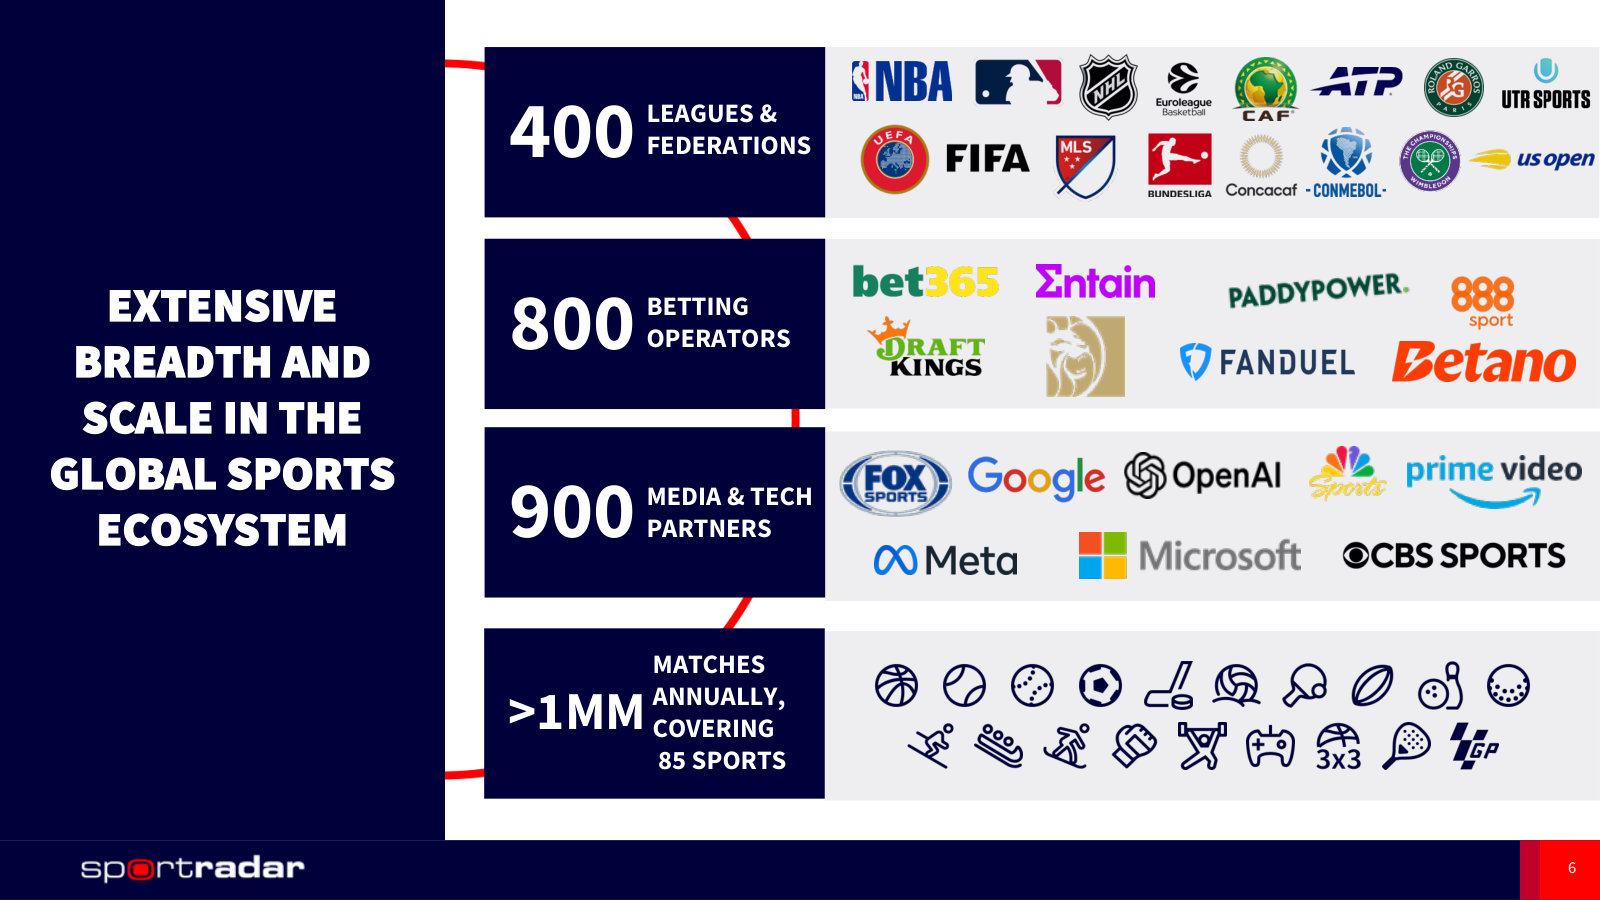
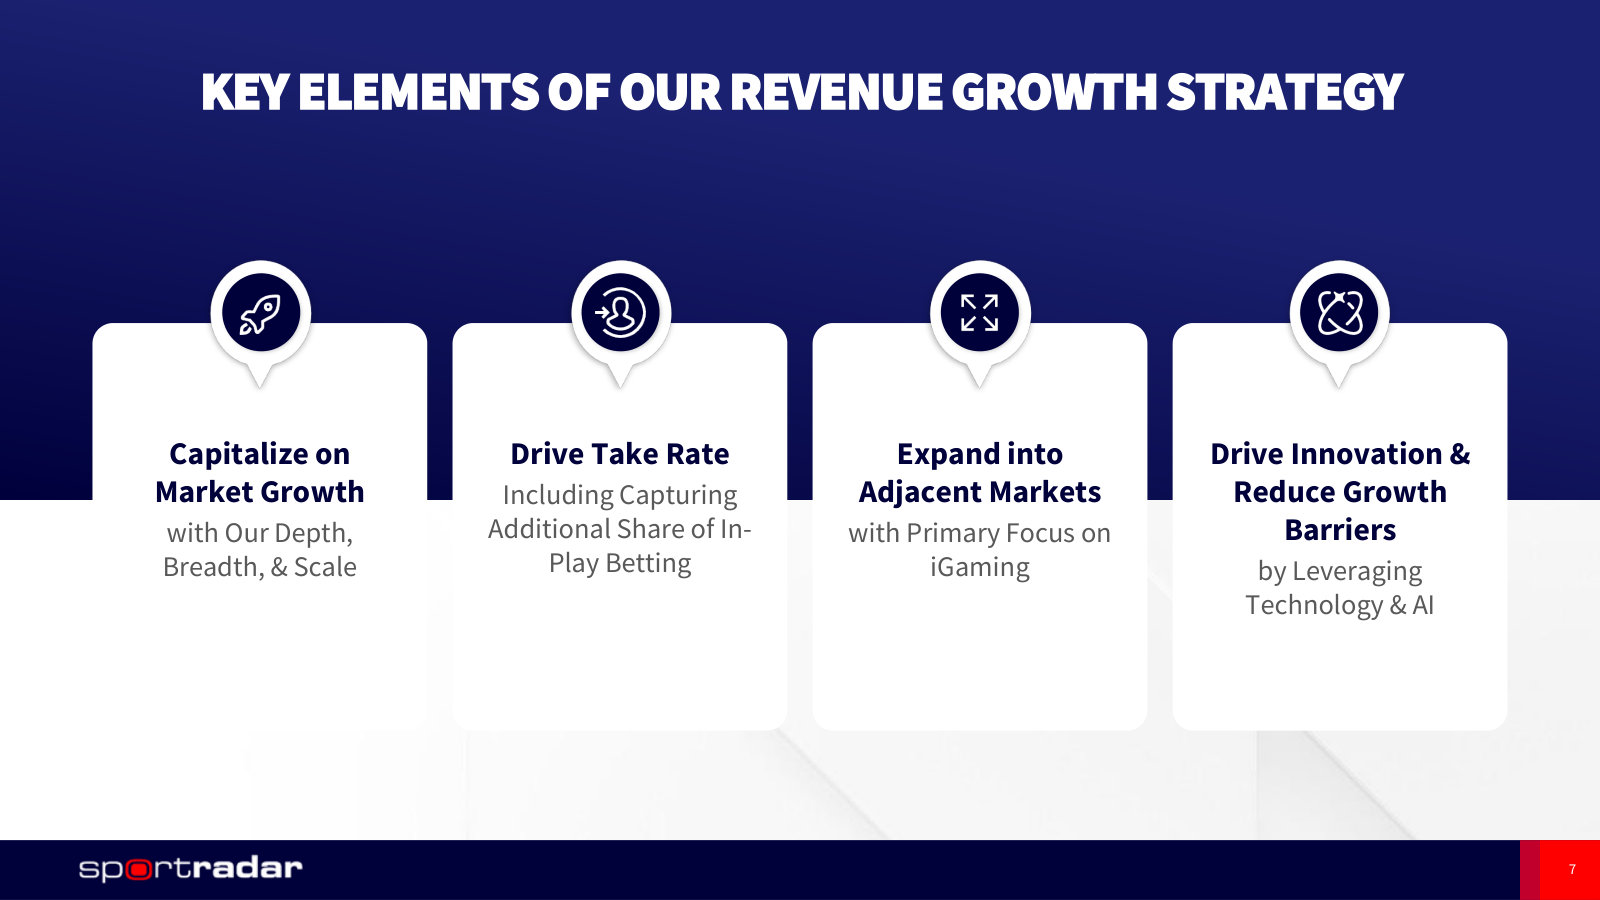
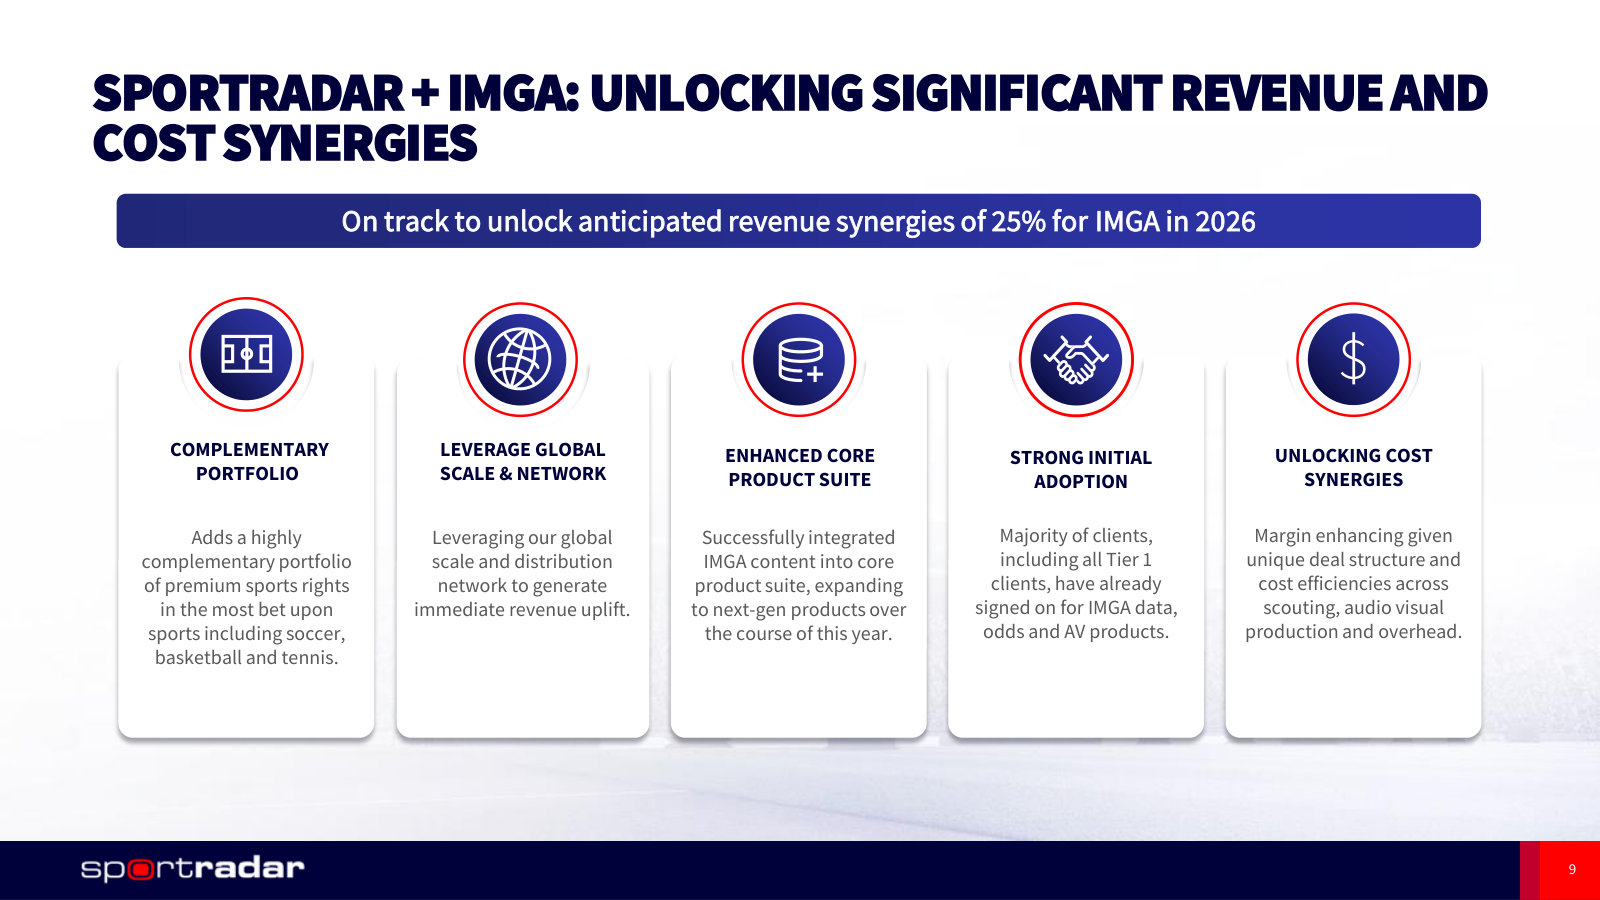
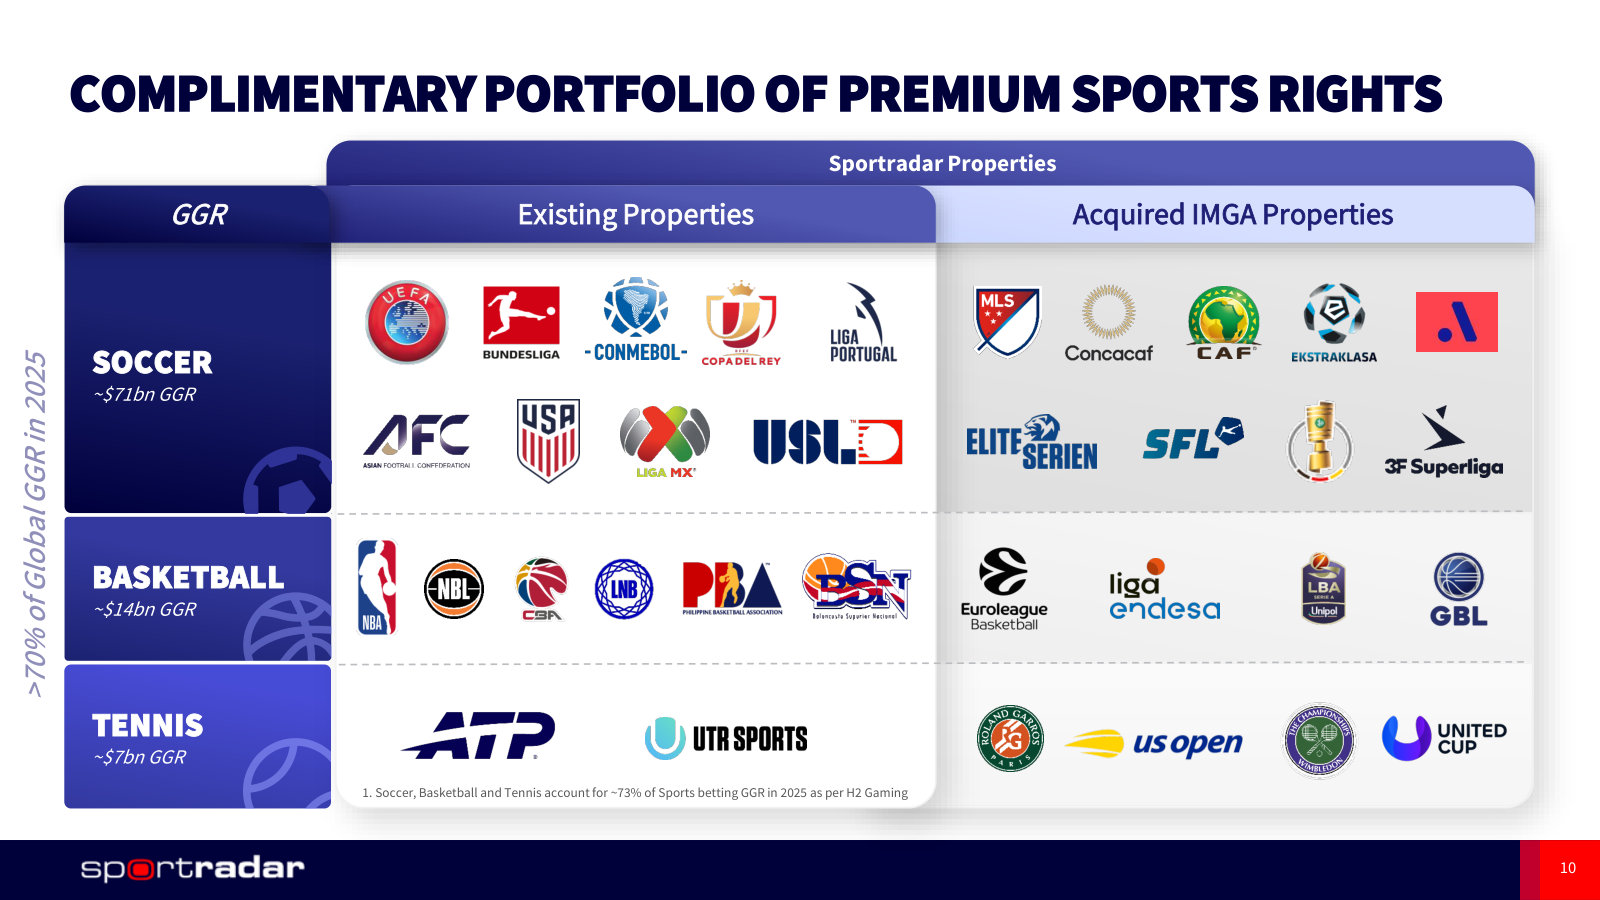
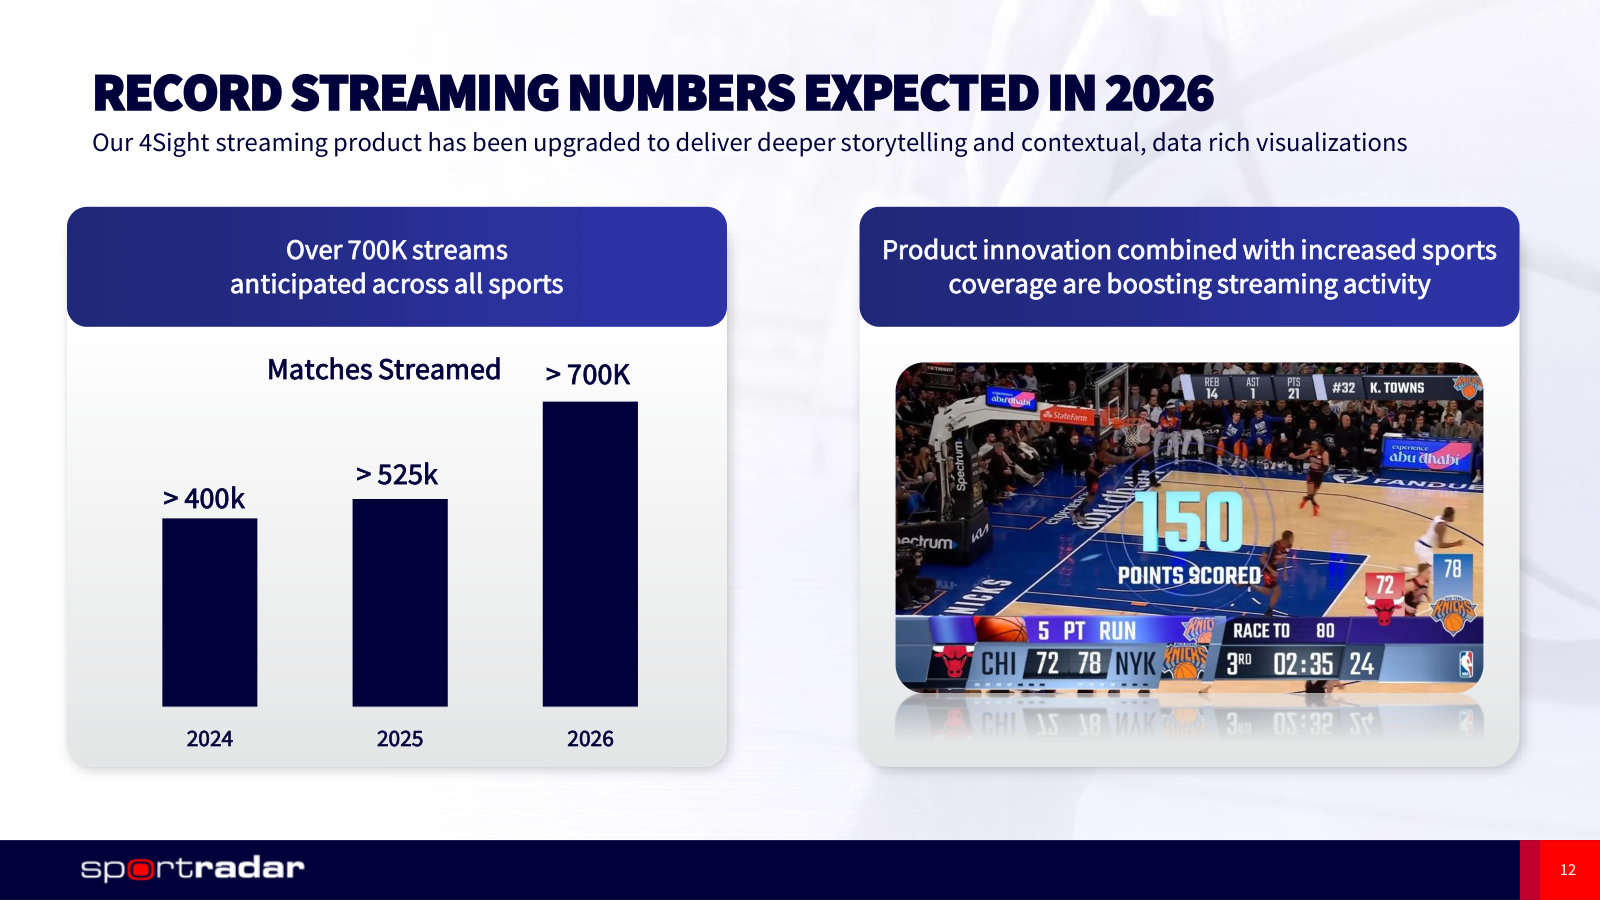
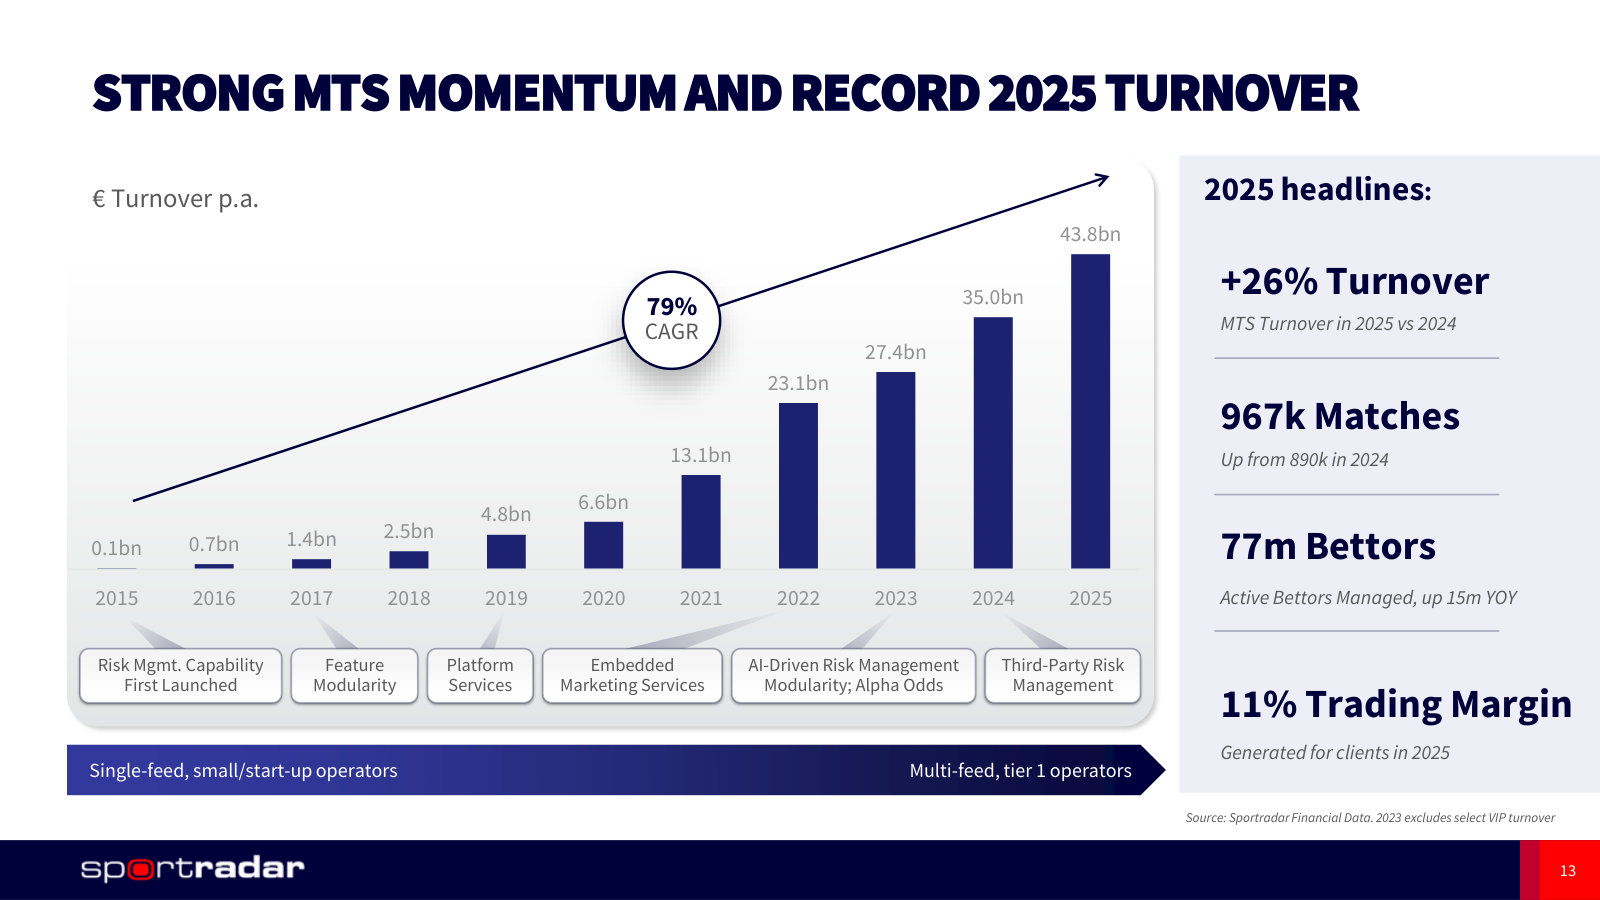
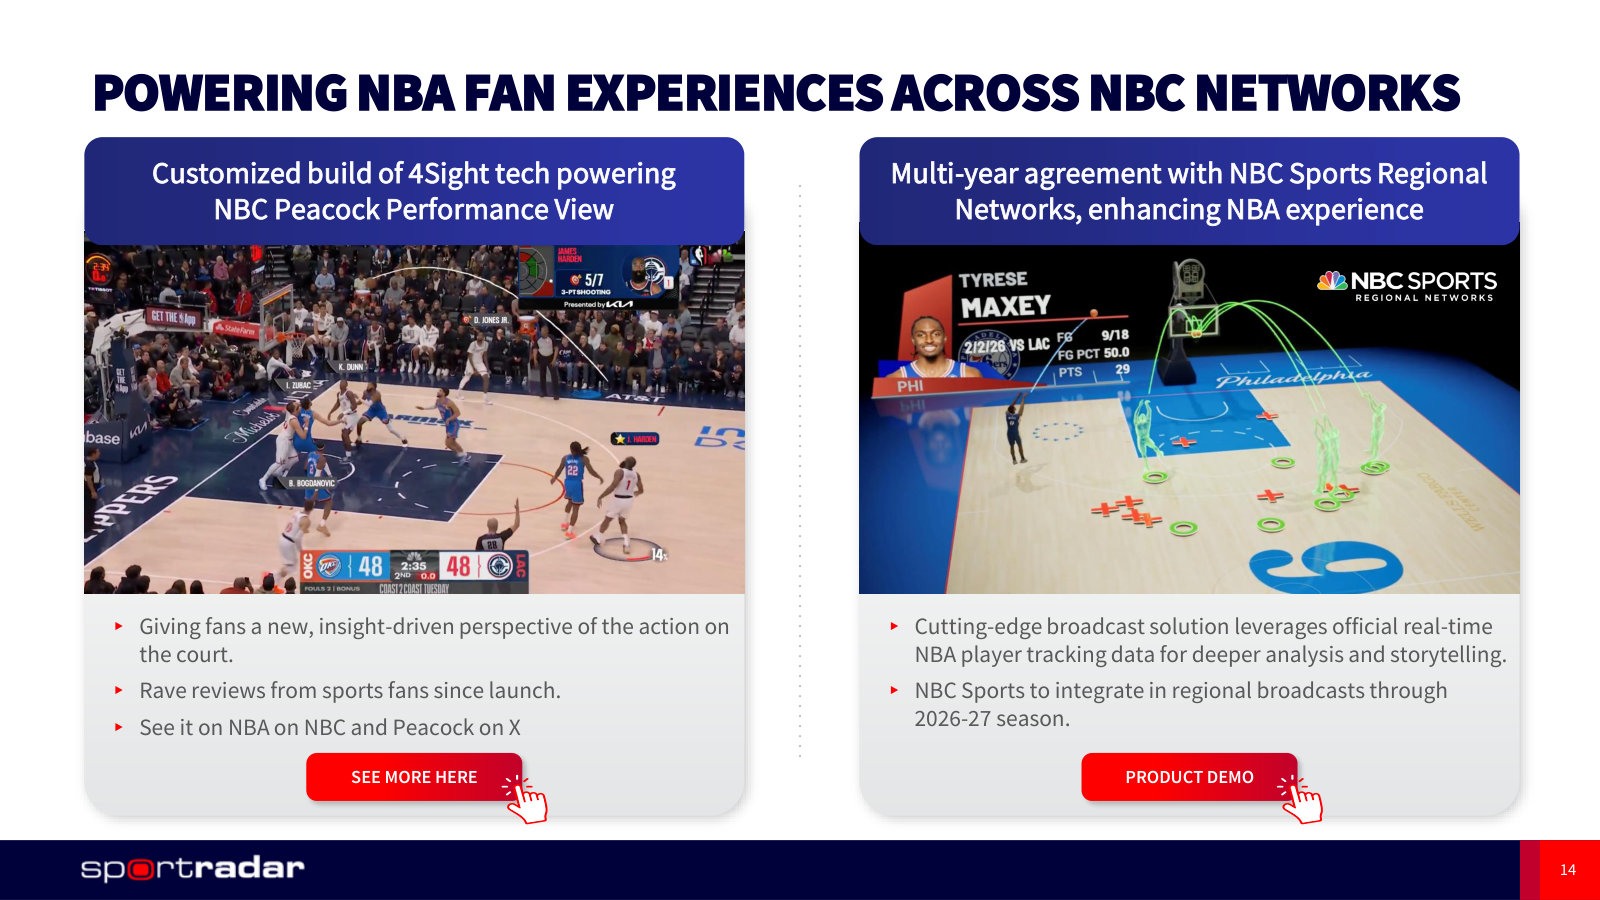
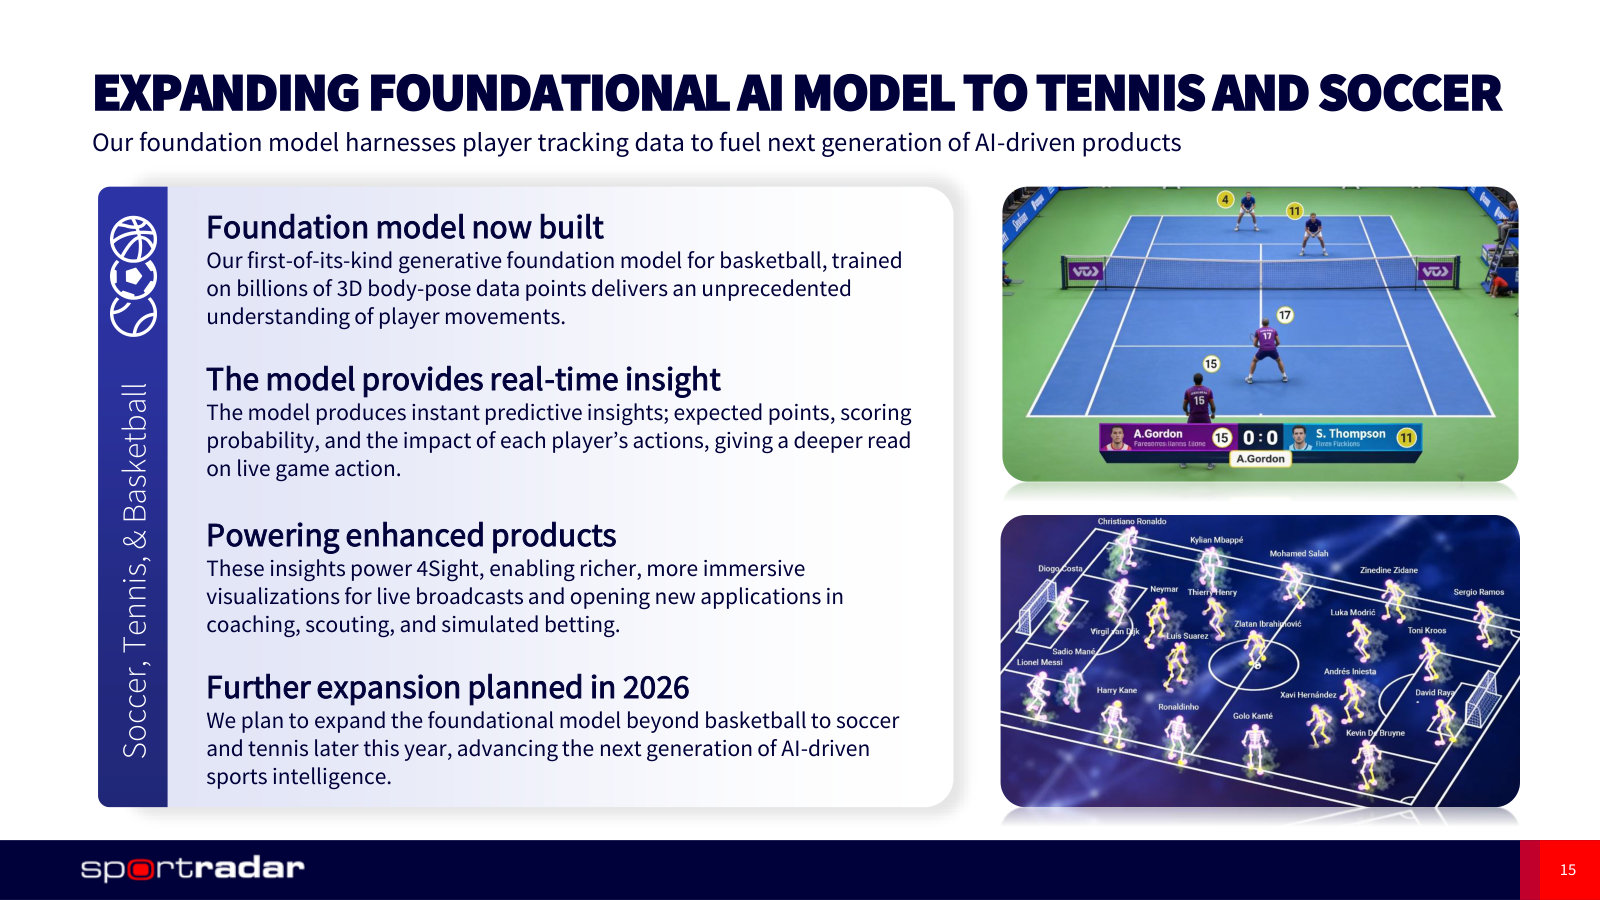
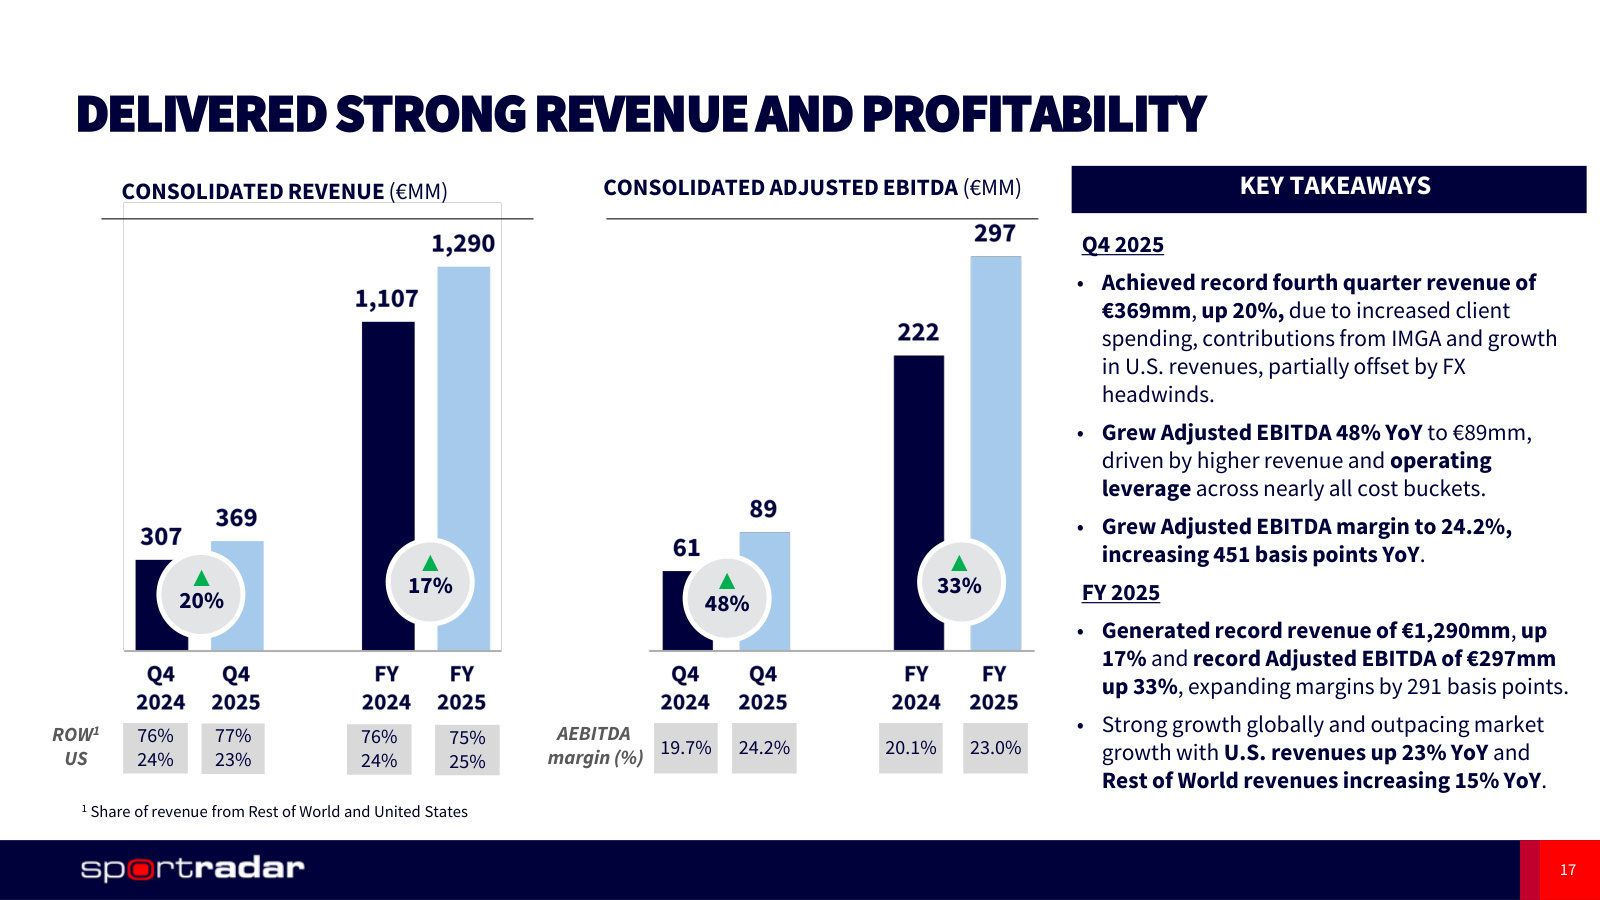
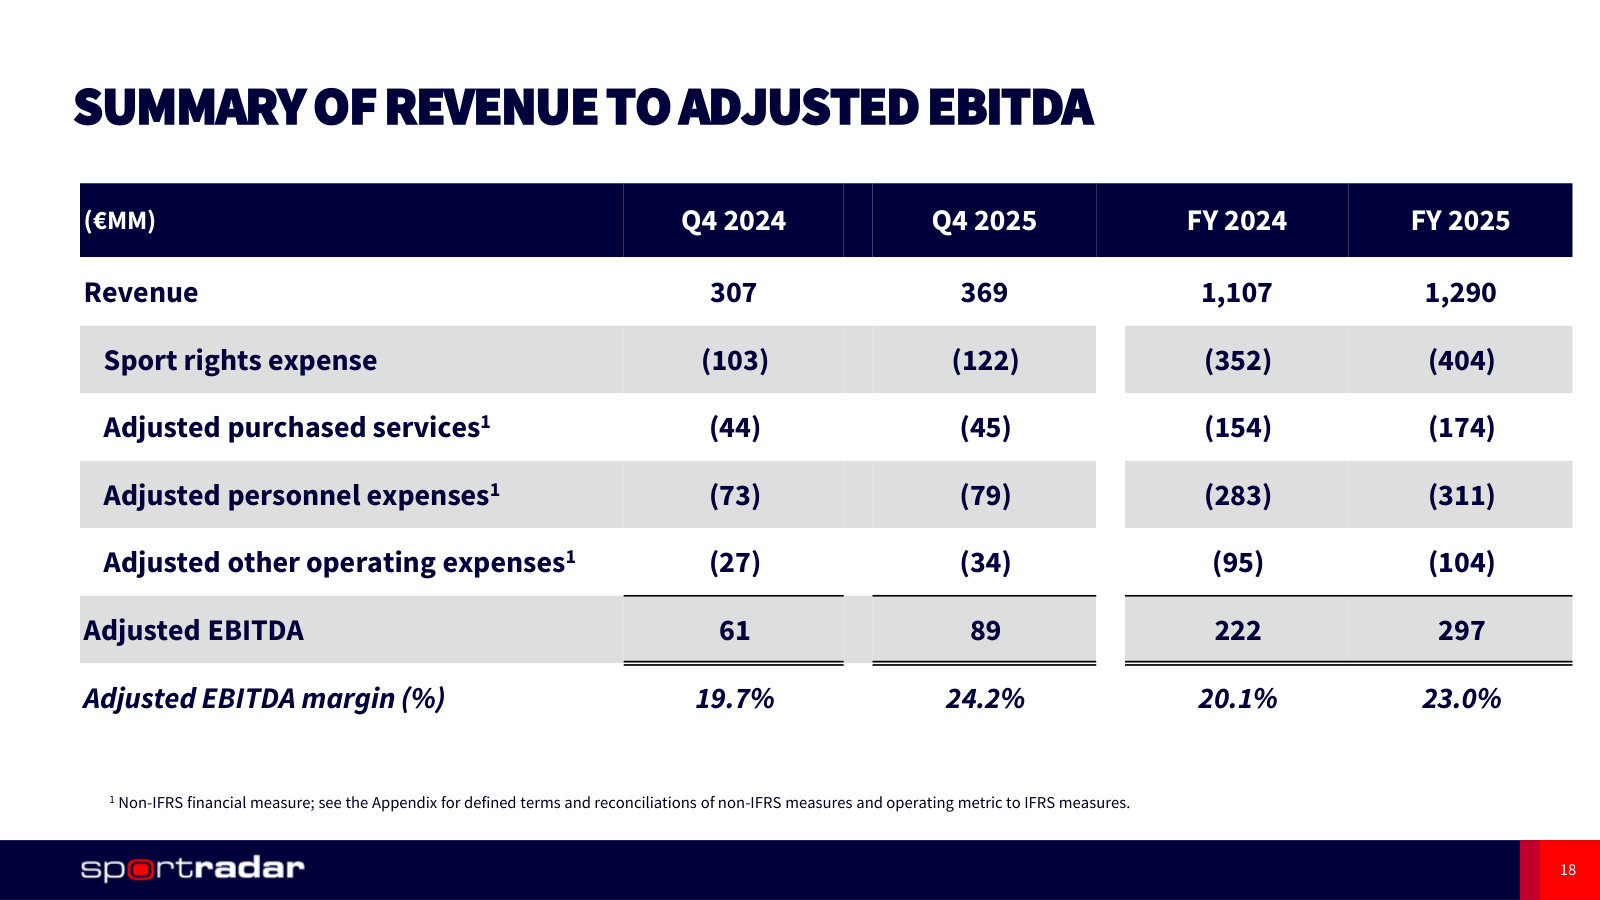
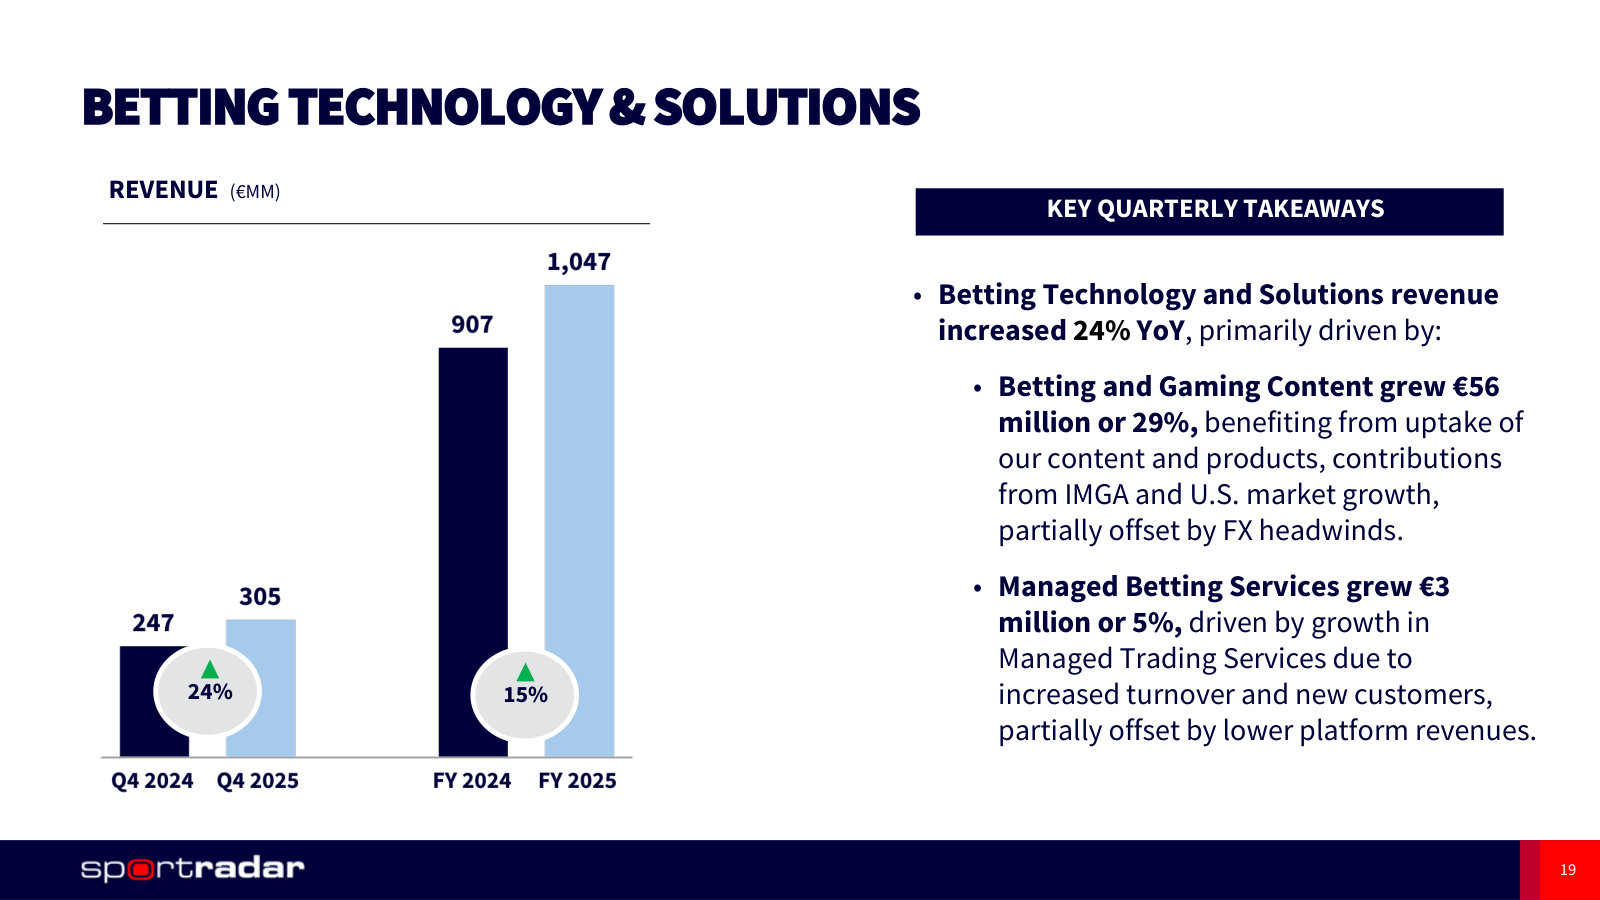
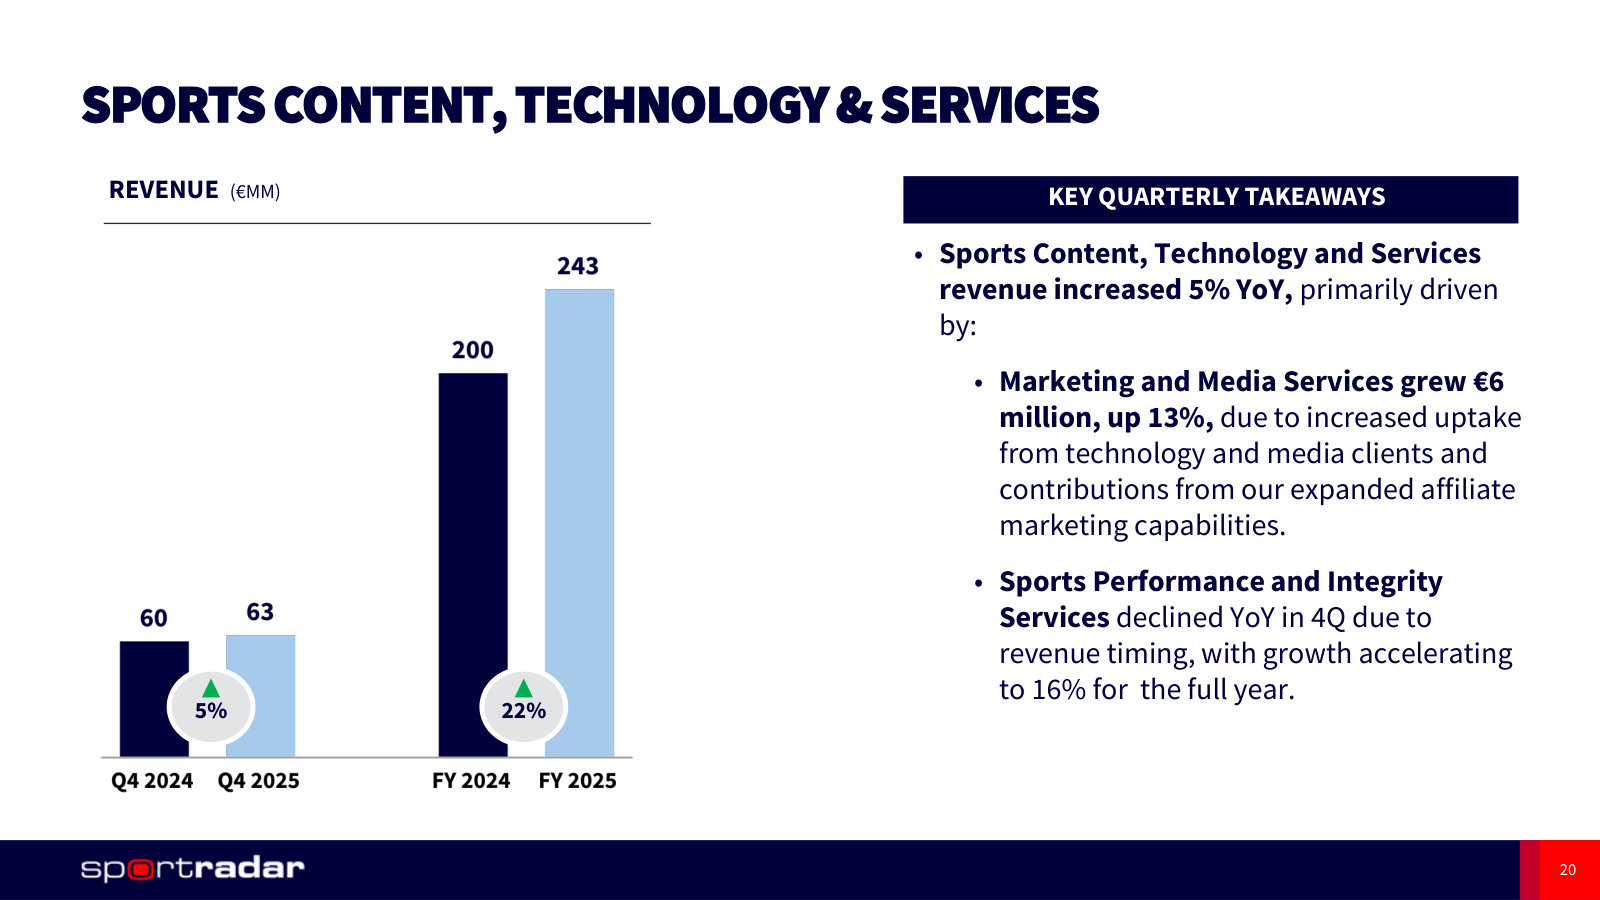
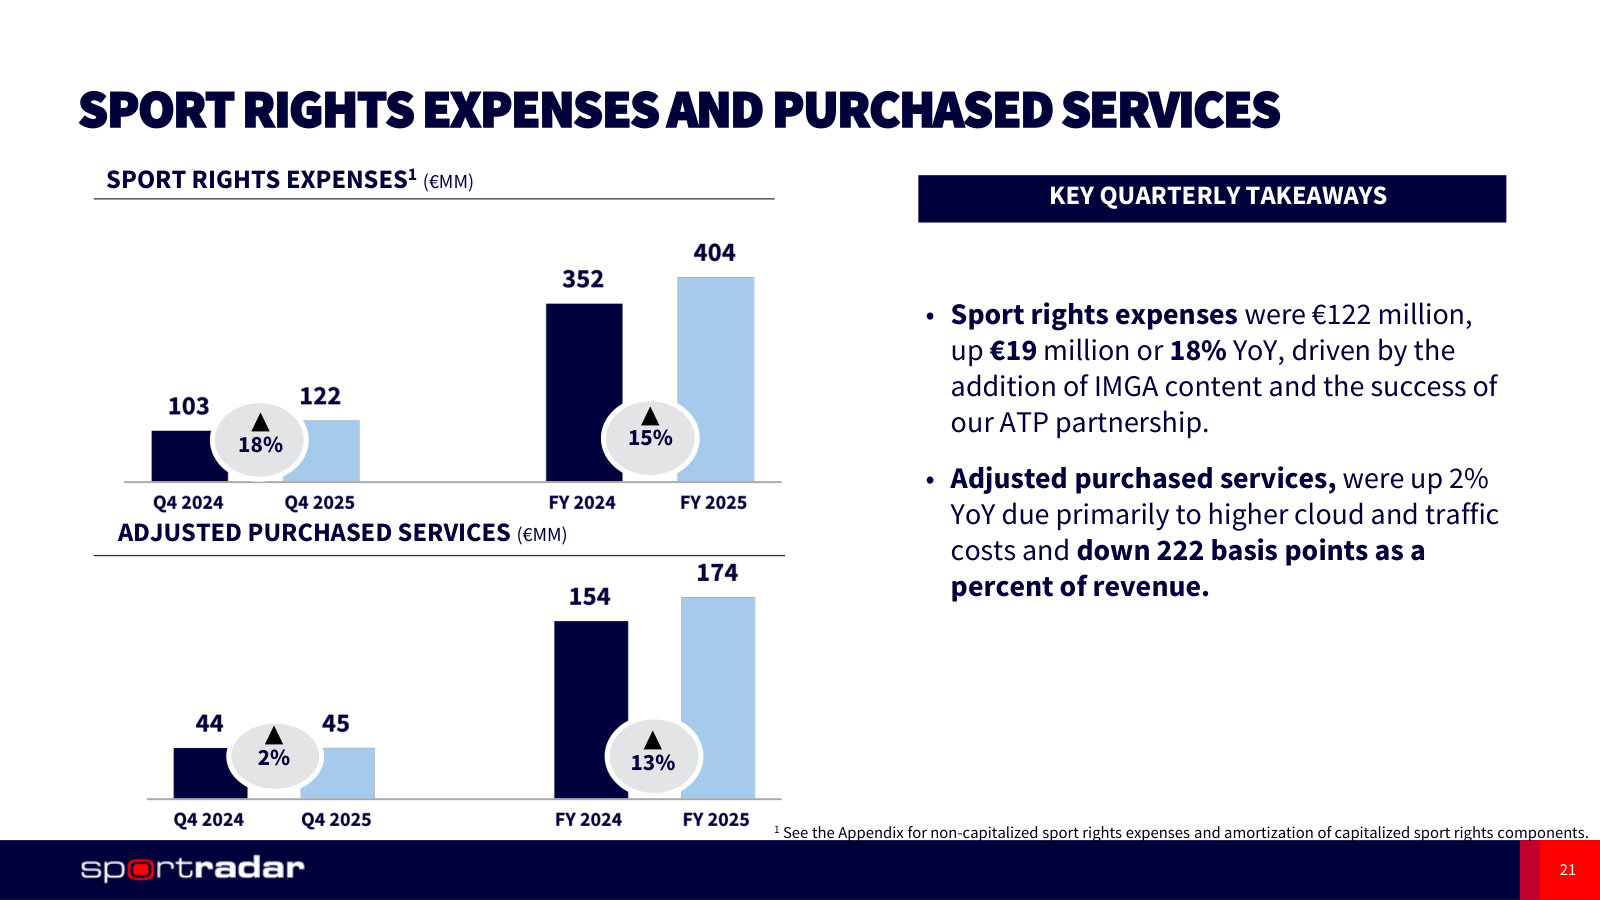
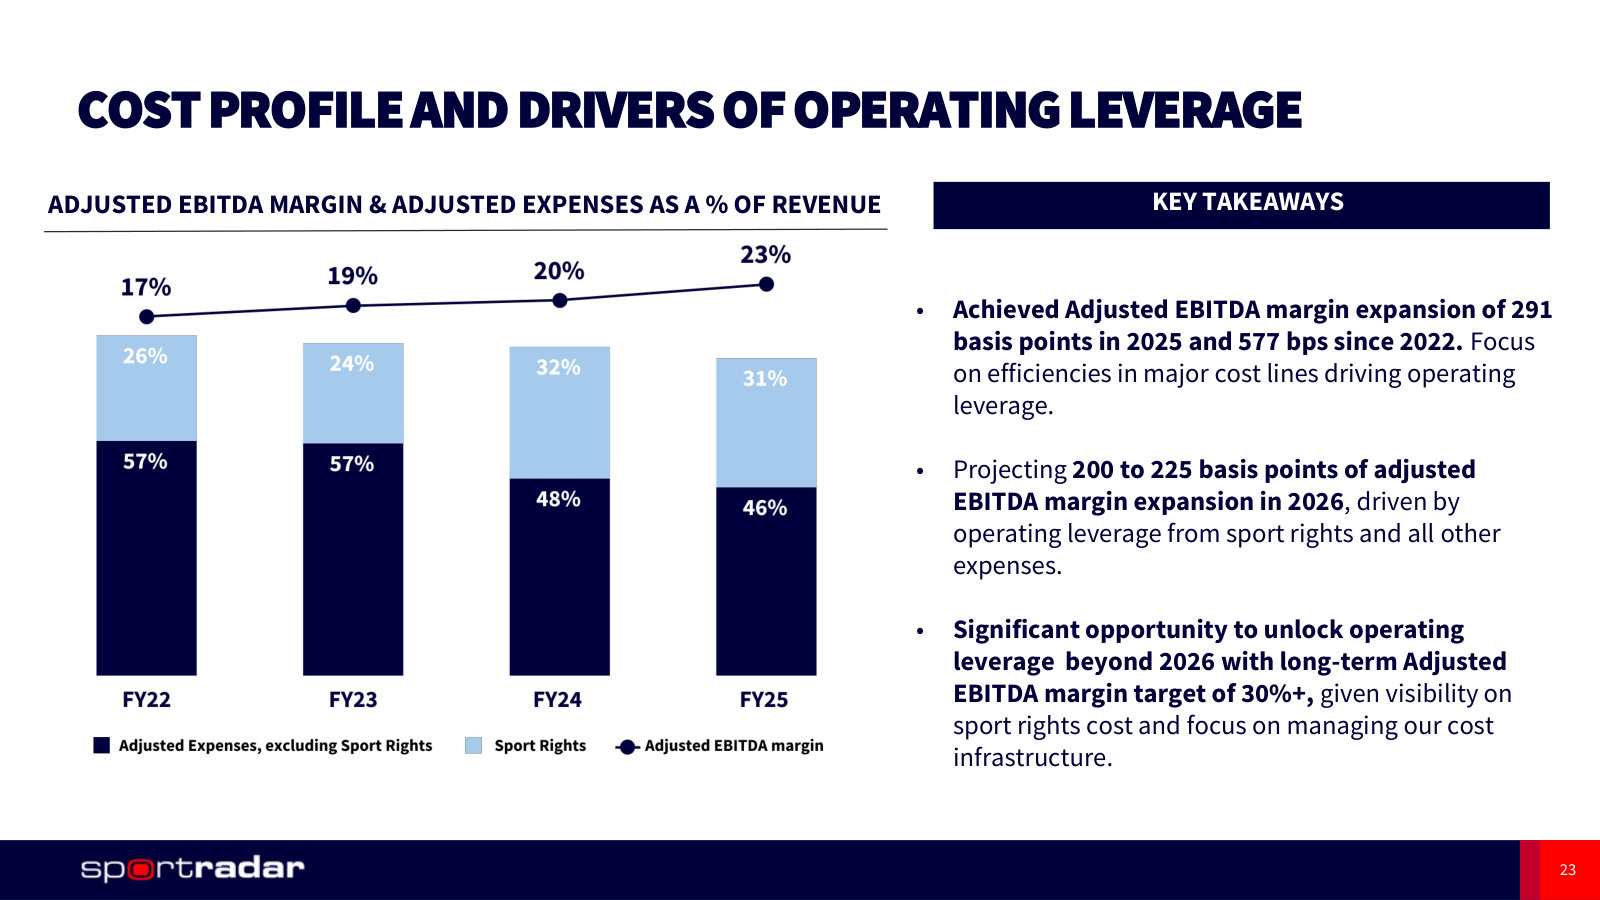
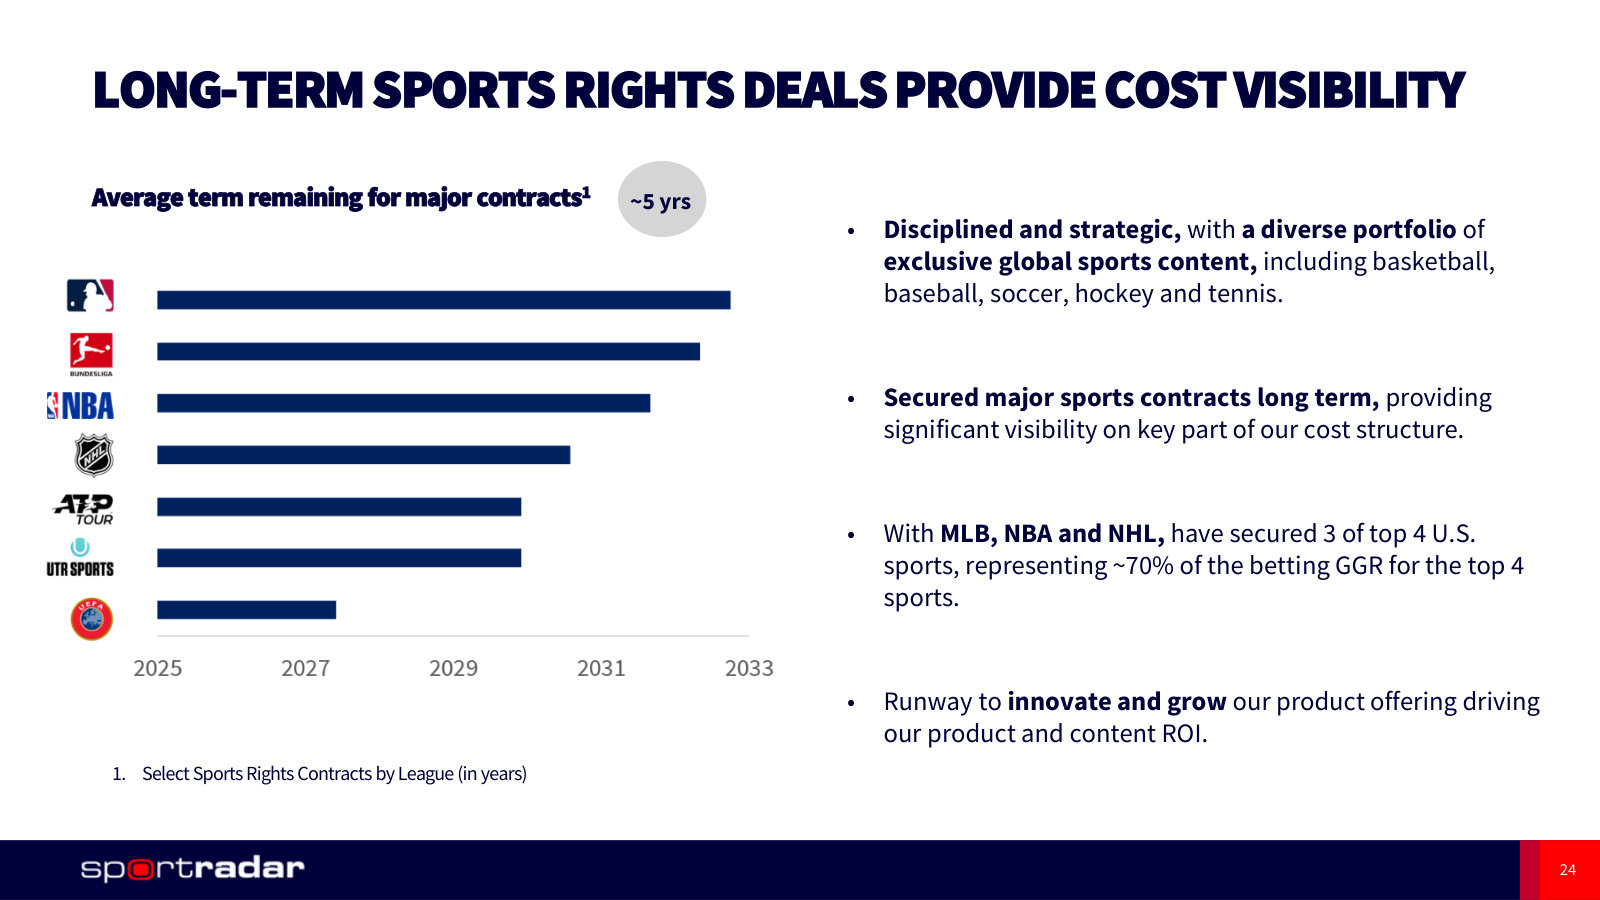
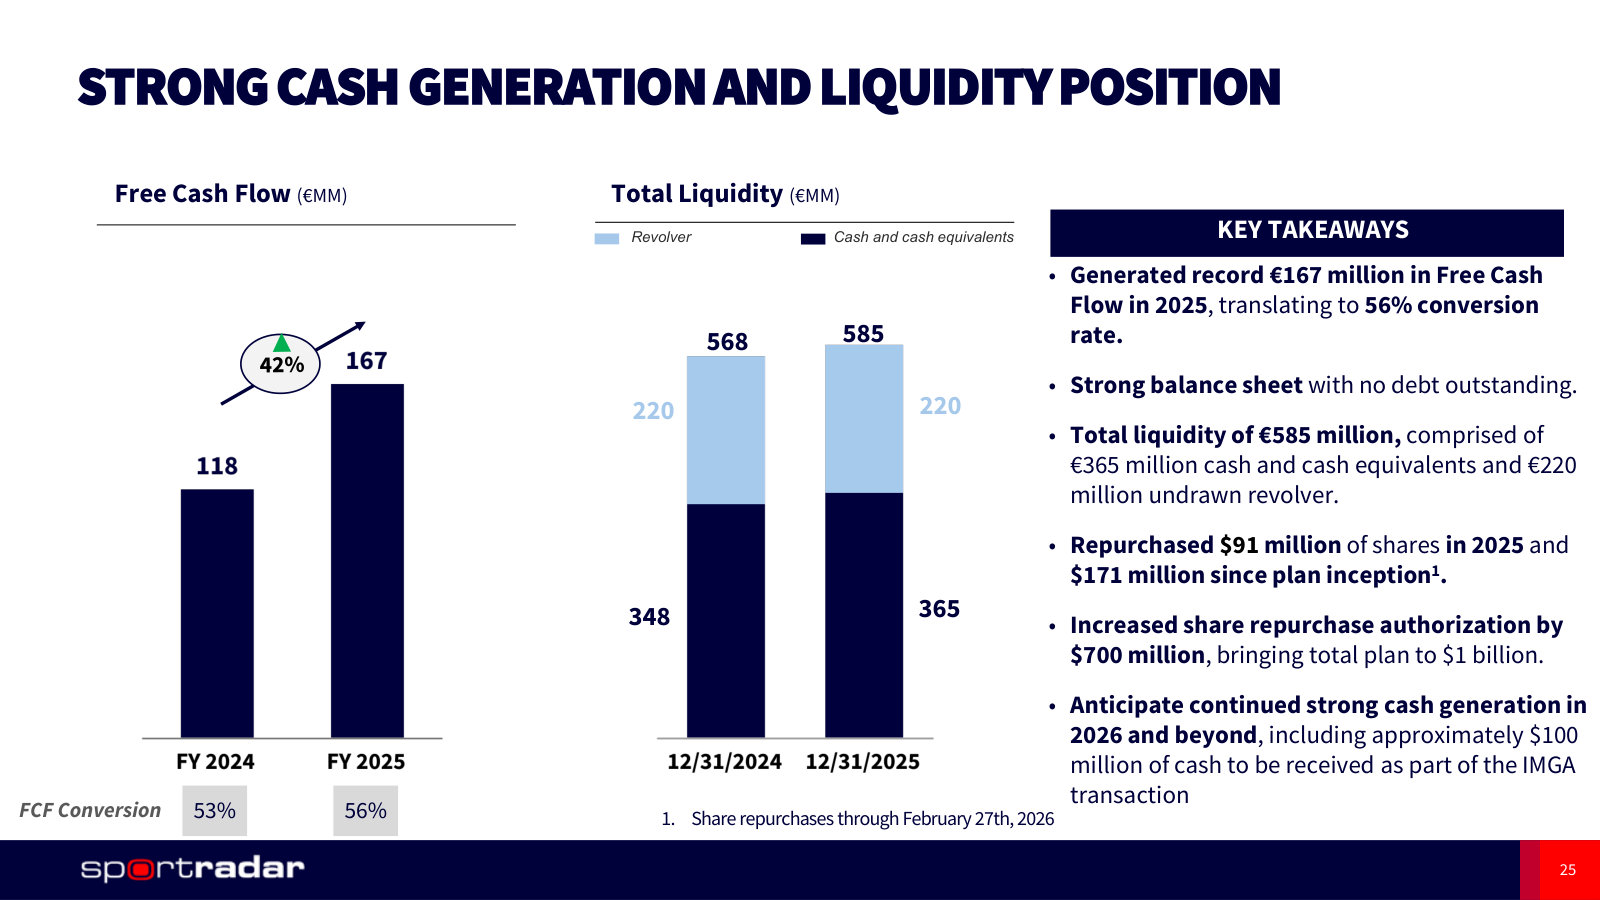
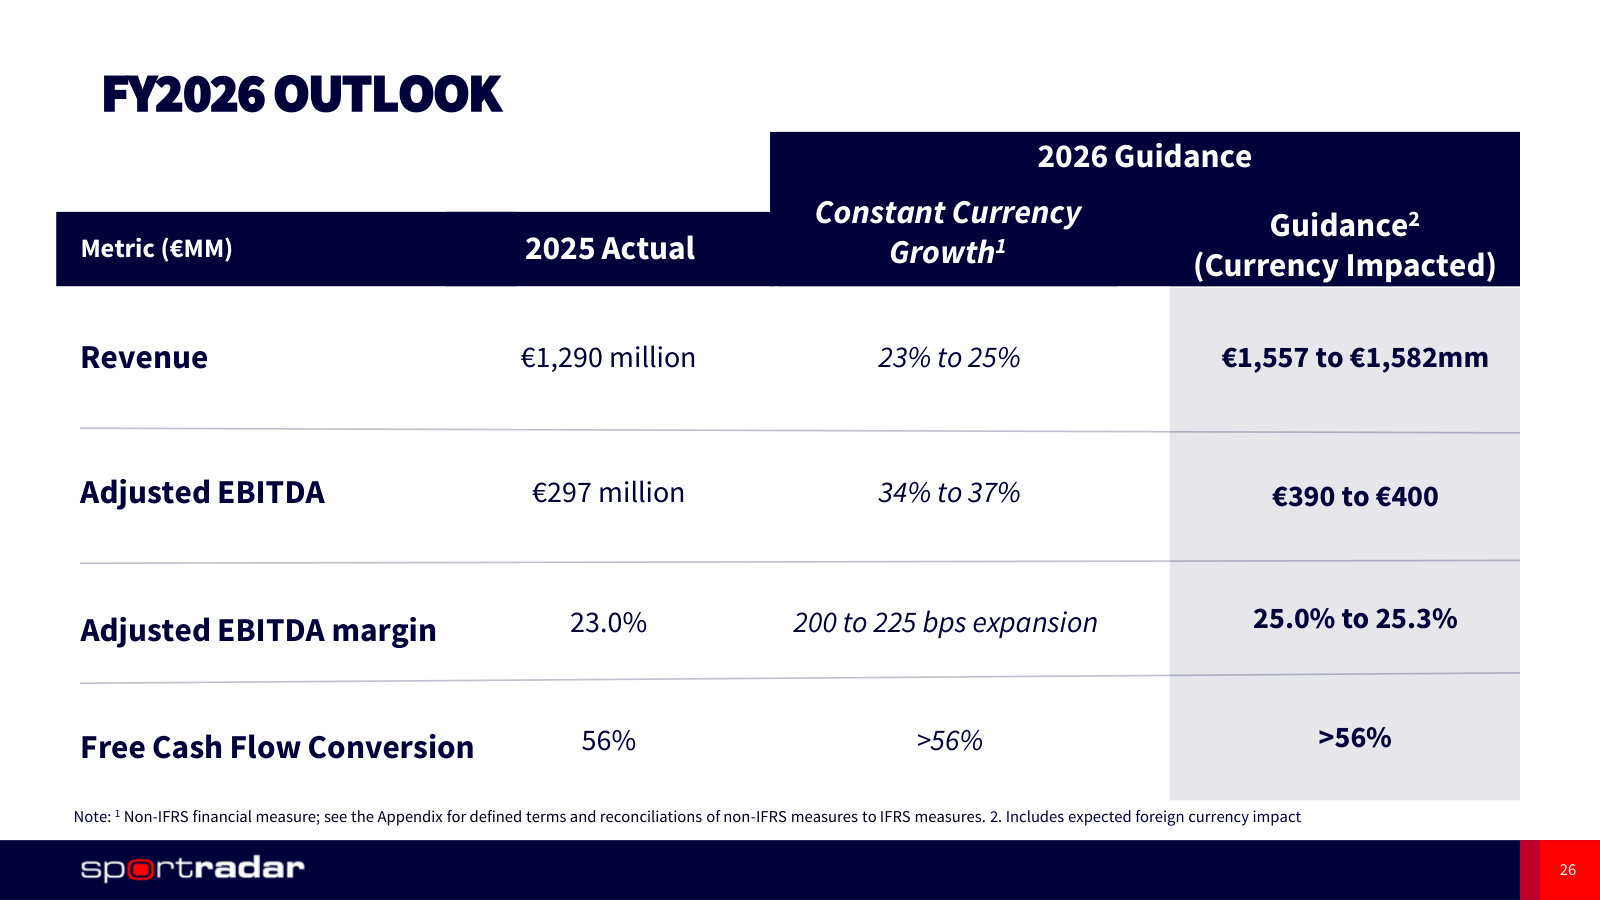
p. 4 — Q4 and full-year 2025 on one page — €1,290m revenue, 23% adjusted EBITDA margin, €167m free cash flow. · Open the full presentation →p. 5 — Five years of revenue split between the two segments; 23% compound growth to €1,290m. · Open the full presentation →p. 6 — Current scale of the ecosystem: 400 leagues, 800 betting operators, 900 media and technology partners. · Open the full presentation →p. 7 — The four-part growth strategy as management frames it today: market growth, take rate, adjacencies, technology. · Open the full presentation →p. 9 — What IMG ARENA is expected to contribute — 25% revenue synergies in 2026, plus scouting and production cost savings. · Open the full presentation →p. 10 — The combined rights portfolio by sport, showing which properties came with IMG ARENA against the GGR each sport carries. · Open the full presentation →p. 12 — Streaming volumes: over 700k matches expected in 2026, up from 400k in 2024. · Open the full presentation →p. 13 — Managed trading turnover reached €43.8bn in 2025 across 77m bettors, at an 11% trading margin for clients. · Open the full presentation →p. 14 — A concrete media deal: 4Sight technology built into NBC's Peacock and regional NBA coverage. · Open the full presentation →p. 15 — The foundation model built on player-tracking data, extending from basketball into tennis and soccer. · Open the full presentation →p. 17 — Revenue and profit for Q4 and the full year, with the US and rest-of-world revenue split beneath. · Open the full presentation →p. 18 — Revenue down to adjusted EBITDA in one table — sports rights is by far the largest cost line. · Open the full presentation →p. 19 — Betting Technology & Solutions, the larger segment: €1,047m in 2025, up 15%. · Open the full presentation →p. 20 — Sports Content, Technology & Services: €243m in 2025, up 22%, driven by marketing and media. · Open the full presentation →p. 21 — Sports rights cost €404m in 2025 and purchased services €174m — the two largest bought-in costs. · Open the full presentation →p. 23 — Four years of margin, showing sports rights and other costs falling as a share of revenue. · Open the full presentation →p. 24 — When the major rights deals expire — about five years of average term left, MLB the longest. · Open the full presentation →p. 25 — Free cash flow of €167m, no debt, €585m of liquidity, and a buyback authorisation raised to $1bn. · Open the full presentation →p. 26 — The 2026 guidance this management is now measured against: €1,557–1,582m revenue and a 25%+ margin. · Open the full presentation →
The latest quarter, and the first place two new lines of business — prediction markets and PlayRadar — are laid out. · Open the full document →
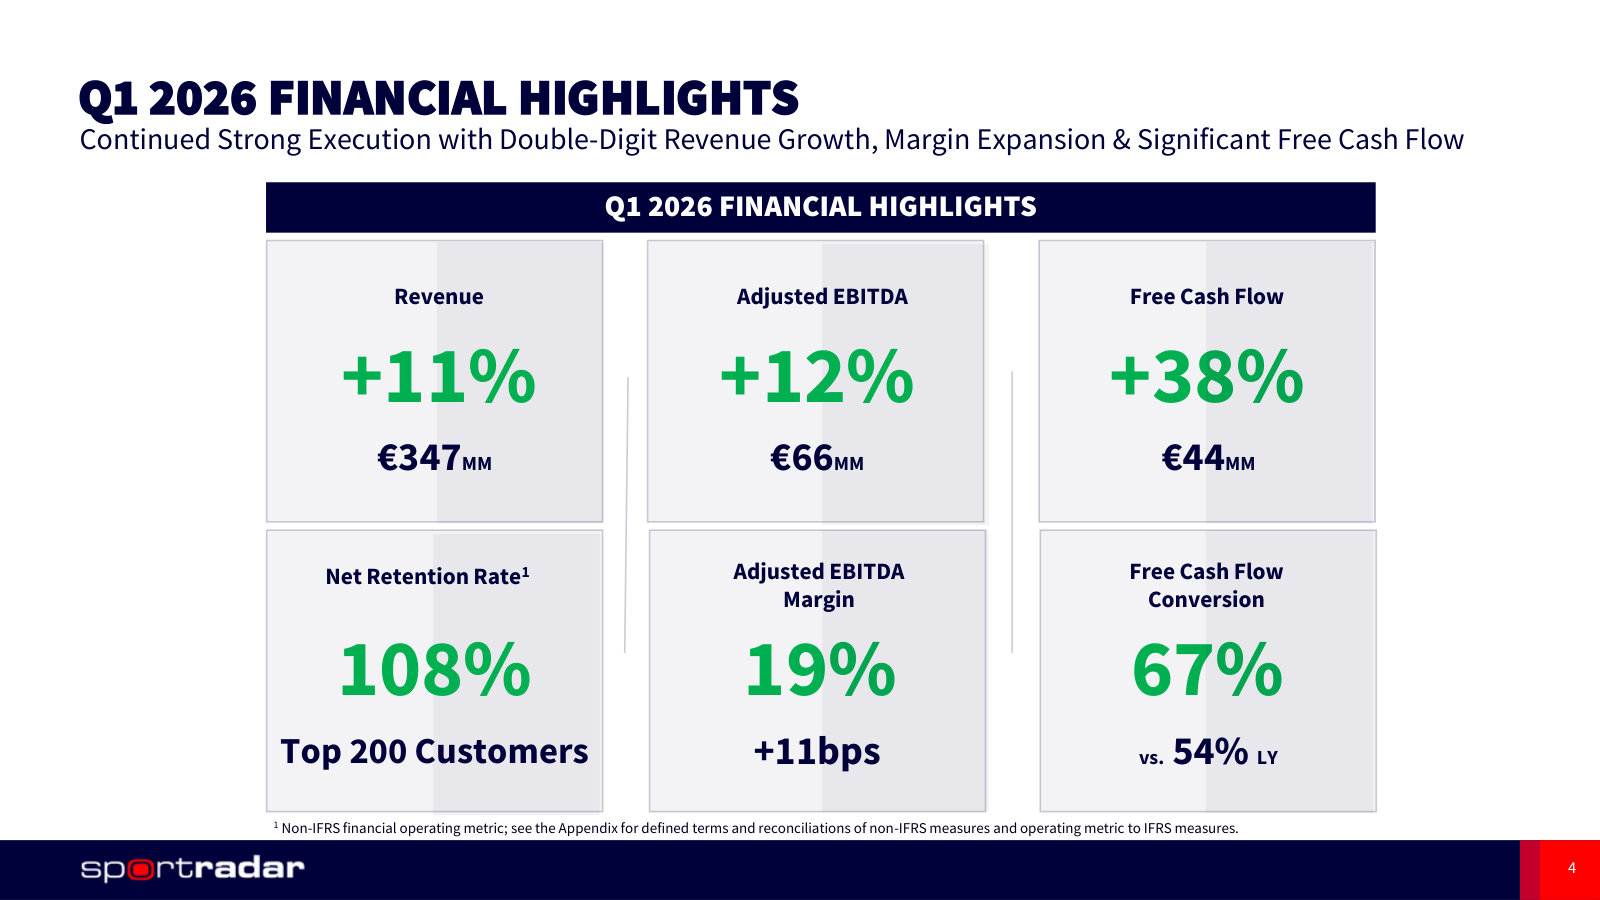
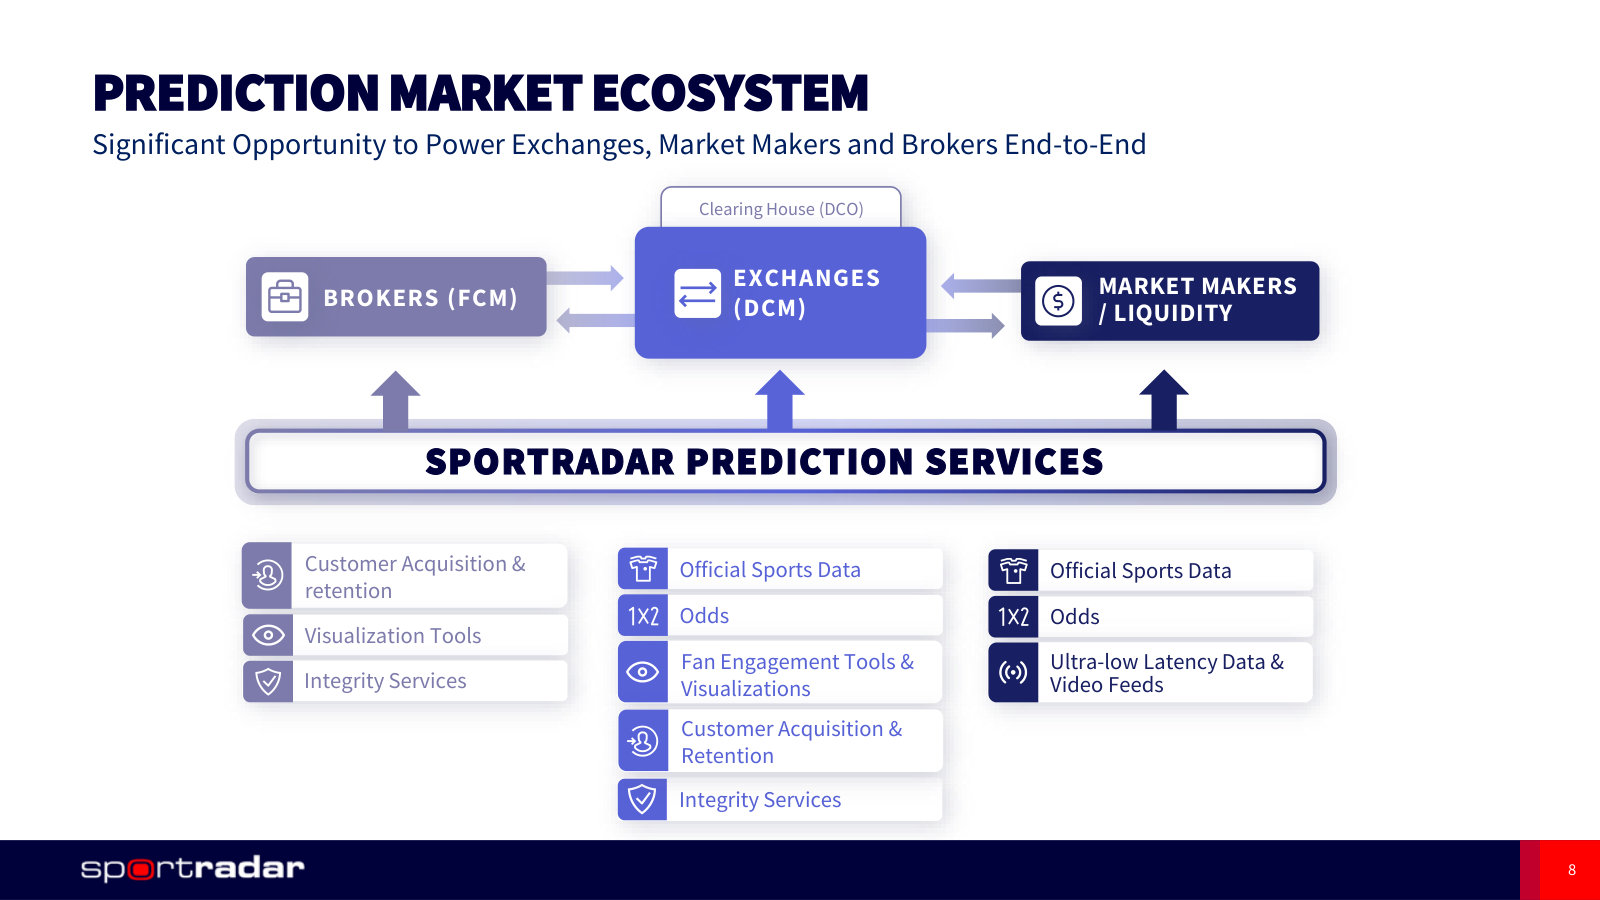
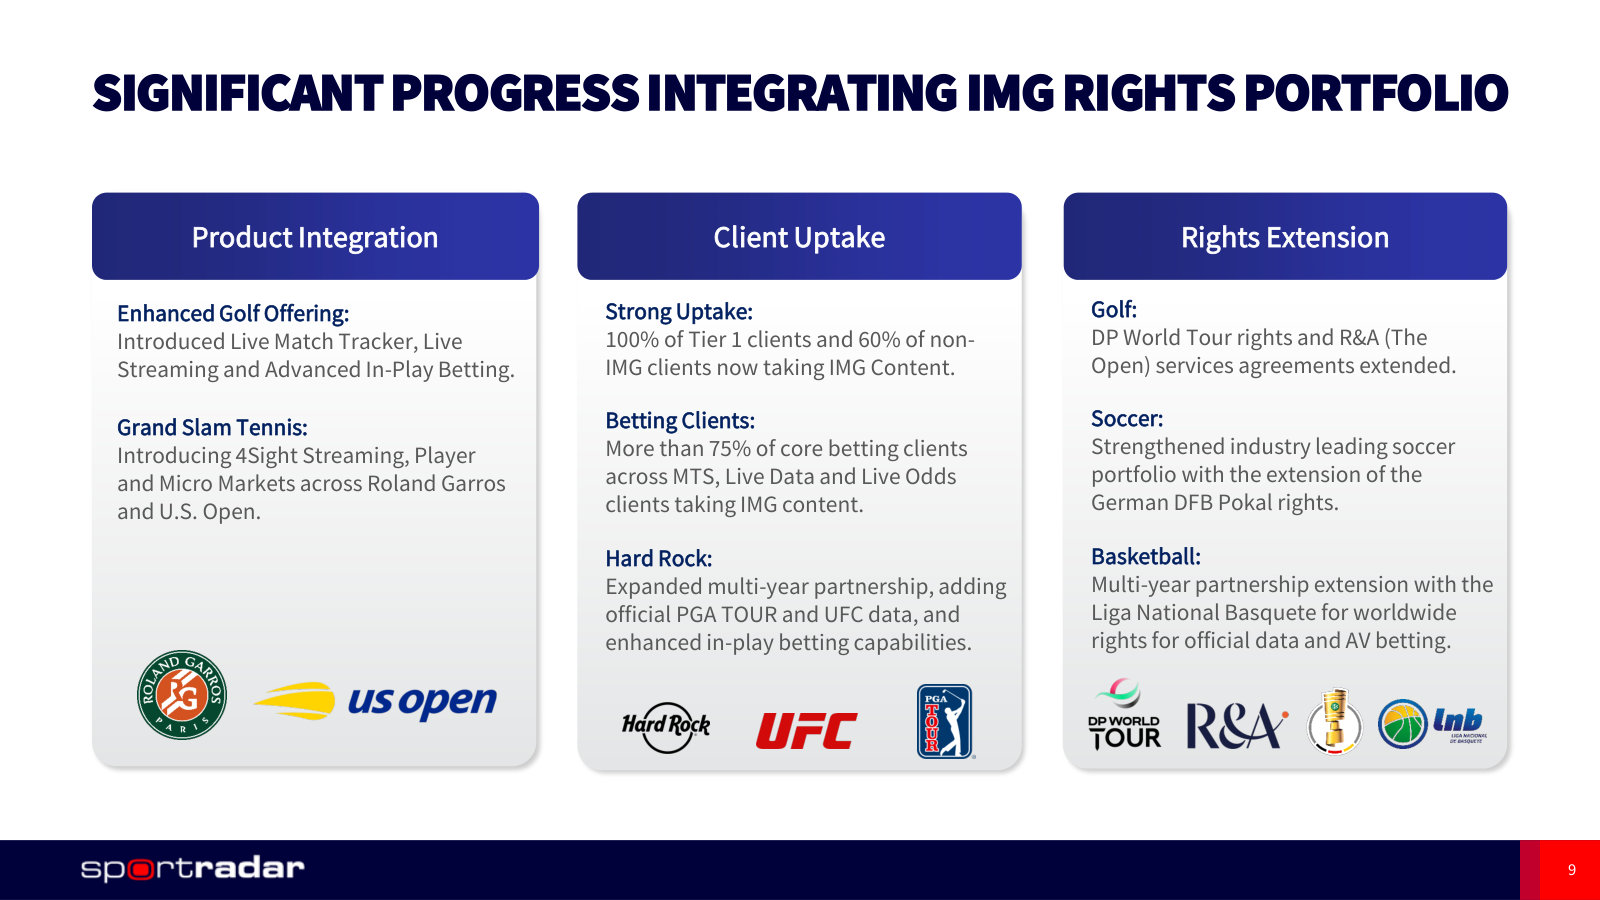
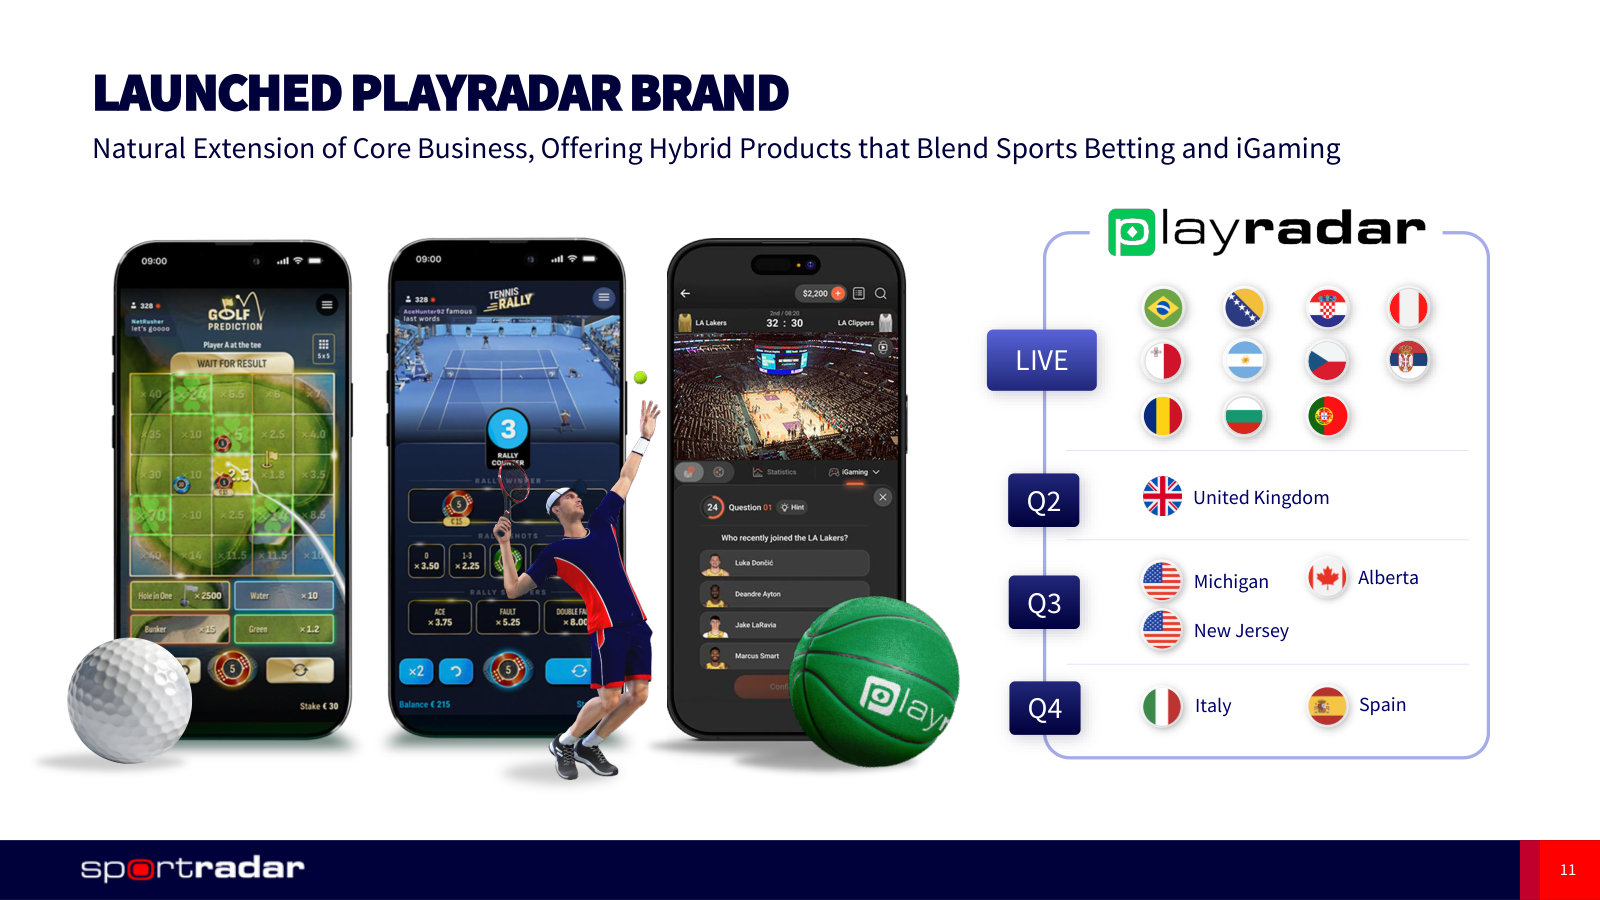
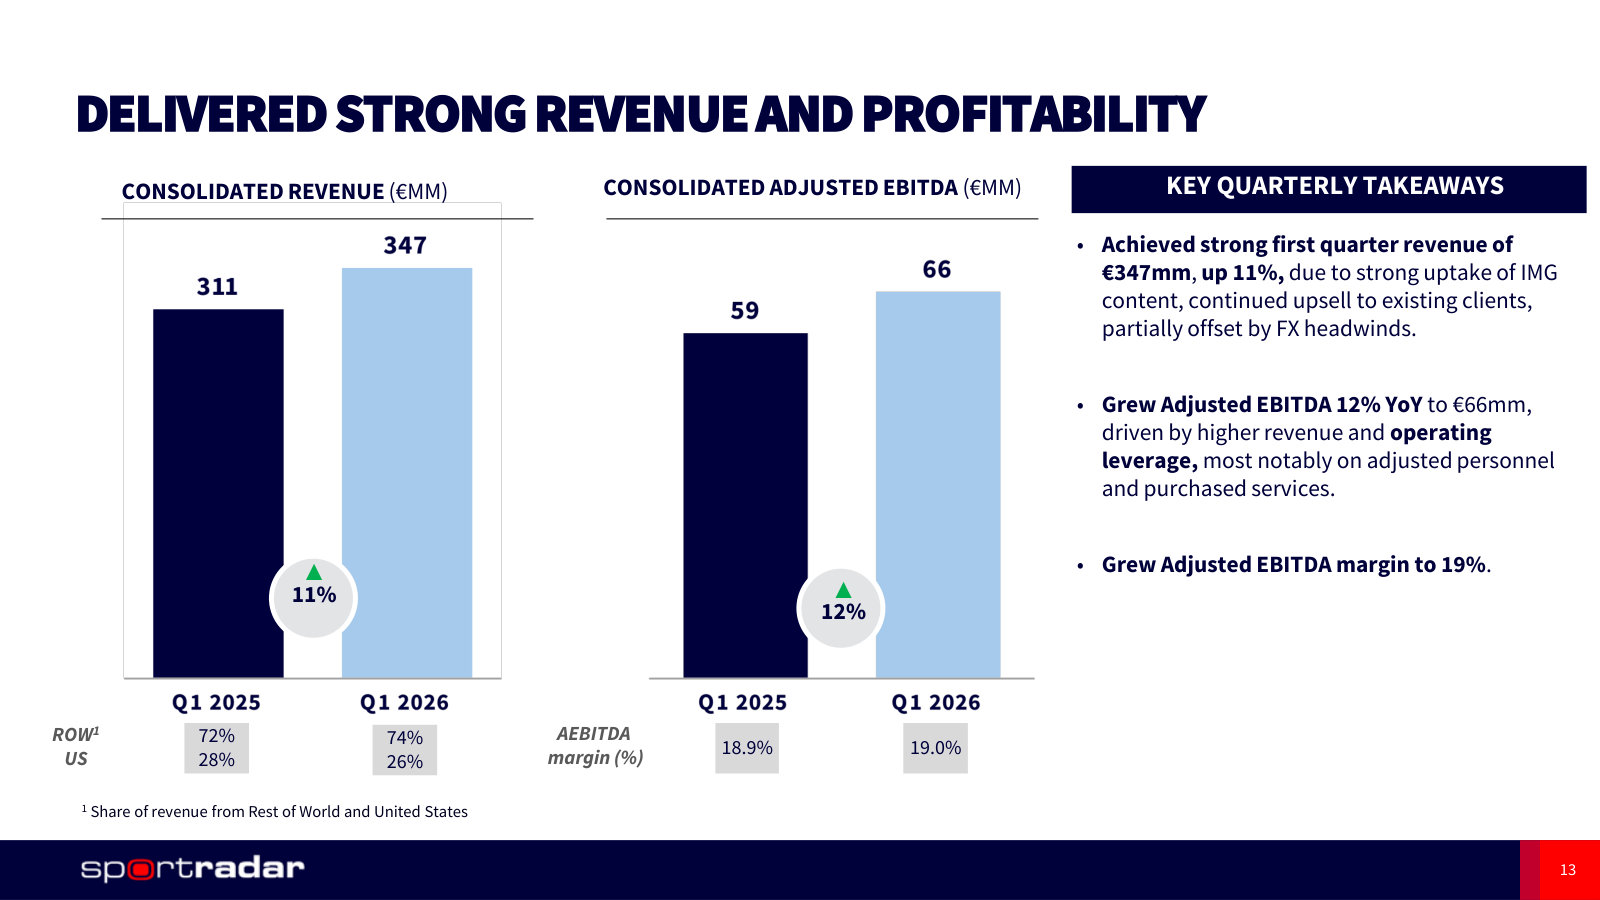
p. 4 — The quarter in numbers: €347m revenue up 11%, 19% adjusted EBITDA margin, 67% free cash flow conversion. · Open the full presentation →p. 8 — The prediction-markets opportunity mapped — what Sportradar would sell to exchanges, brokers and market makers. · Open the full presentation →p. 9 — Where IMG ARENA integration stands: all tier-1 clients taking the content, plus golf and tennis rights extensions. · Open the full presentation →p. 11 — PlayRadar, the new hybrid betting and iGaming brand, and the market-by-market rollout planned through 2026. · Open the full presentation →p. 13 — Q1 revenue and profit with the US at 26% of the total — the current scoreboard behind the reaffirmed guidance. · Open the full presentation →
Third Quarter 2025 Earnings — Q3 2025 · 30 pages · The last quarter reported before IMG ARENA consolidated — the clean standalone run-rate of the old business. · Open →
Fourth Quarter & Full Year 2024 Earnings — FY2024 · 33 pages · Where the IMG ARENA acquisition was announced and the 2024 base year behind the 2027 targets was set. · Open →
Fourth Quarter & Full Year 2023 Earnings — FY2023 · 27 pages · The pre-Investor-Day baseline: €878m of revenue and what management was promising before the 2027 plan. · Open →